备注
Go to the end to download the full example code..
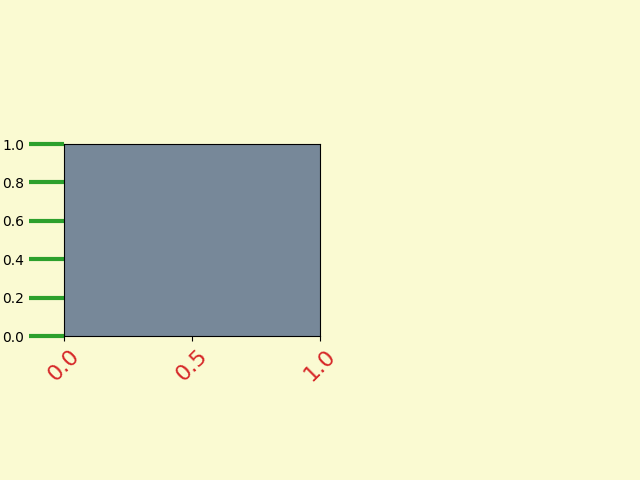
Fig Axes Customize Simple#
自定义简单绘图的背景,标签和刻度.
import matplotlib.pyplot as plt
pyplot.figure 创建一个 matplotlib.figure.Figure 实例.
fig = plt.figure()
rect = fig.patch  # a rectangle instance
rect.set_facecolor('lightgoldenrodyellow')

ax1 = fig.add_axes([0.1, 0.3, 0.4, 0.4])
rect = ax1.patch
rect.set_facecolor('lightslategray')

ax1.tick_params(axis='x', labelcolor='tab:red', labelrotation=45, labelsize=16)
ax1.tick_params(axis='y', color='tab:green', size=25, width=3)

plt.show()
参考
以下函数,方法,类和模块的用法在本例中显示:
matplotlib.axis.Axis.get_ticklabelsmatplotlib.axis.Axis.get_ticklinesmatplotlib.text.Text.set_rotationmatplotlib.text.Text.set_fontsizematplotlib.text.Text.set_colormatplotlib.lines.Line2Dmatplotlib.lines.Line2D.set_markeredgecolormatplotlib.lines.Line2D.set_markersizematplotlib.lines.Line2D.set_markeredgewidthmatplotlib.patches.Patch.set_facecolor