备注
Go to the end 下载完整的示例代码.
在 2D 图像中混合透明度与颜色#
使用透明度与颜色混合来突出显示使用 imshow 显示的数据部分.
matplotlib.pyplot.imshow 的一个常见用途是绘制 2D 统计图.该函数可以轻松地将 2D 矩阵可视化为图像,并向输出添加透明度.例如,可以绘制一个统计量(例如 t 统计量),并根据其 p 值对每个像素的透明度进行着色.本示例演示了如何实现此效果.
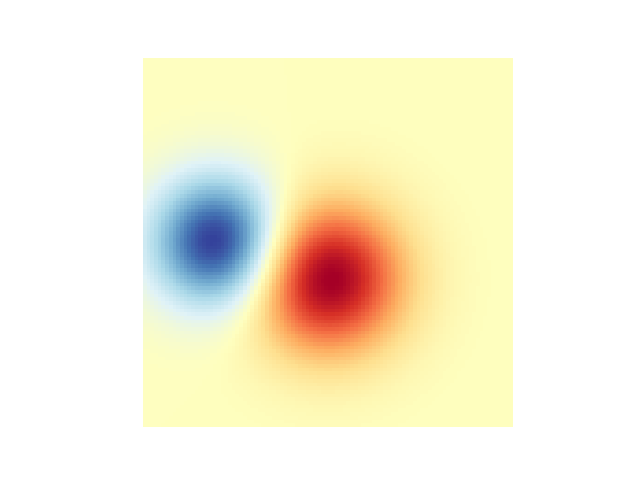
首先,我们将生成一些数据,在本例中,我们将在一个 2D 网格中创建两个 2D "blob".一个 blob 将为正,另一个为负.
import matplotlib.pyplot as plt
import numpy as np

from matplotlib.colors import Normalize


def normal_pdf(x, mean, var):
    return np.exp(-(x - mean)**2 / (2*var))


# Generate the space in which the blobs will live
xmin, xmax, ymin, ymax = (0, 100, 0, 100)
n_bins = 100
xx = np.linspace(xmin, xmax, n_bins)
yy = np.linspace(ymin, ymax, n_bins)

# Generate the blobs. The range of the values is roughly -.0002 to .0002
means_high = [20, 50]
means_low = [50, 60]
var = [150, 200]

gauss_x_high = normal_pdf(xx, means_high[0], var[0])
gauss_y_high = normal_pdf(yy, means_high[1], var[0])

gauss_x_low = normal_pdf(xx, means_low[0], var[1])
gauss_y_low = normal_pdf(yy, means_low[1], var[1])

weights = (np.outer(gauss_y_high, gauss_x_high)
           - np.outer(gauss_y_low, gauss_x_low))

# We'll also create a grey background into which the pixels will fade
greys = np.full((*weights.shape, 3), 70, dtype=np.uint8)

# First we'll plot these blobs using ``imshow`` without transparency.
vmax = np.abs(weights).max()
imshow_kwargs = {
    'vmax': vmax,
    'vmin': -vmax,
    'cmap': 'RdYlBu',
    'extent': (xmin, xmax, ymin, ymax),
}

fig, ax = plt.subplots()
ax.imshow(greys)
ax.imshow(weights, **imshow_kwargs)
ax.set_axis_off()
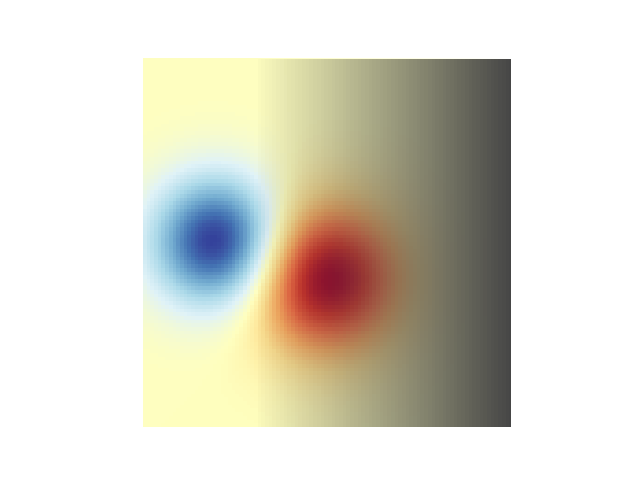
混合透明度#
在使用 matplotlib.pyplot.imshow 绘制数据时包含透明度的最简单方法是将与数据形状匹配的数组传递给 alpha 参数.例如,我们将在下面创建一个从左到右移动的渐变.
# Create an alpha channel of linearly increasing values moving to the right.
alphas = np.ones(weights.shape)
alphas[:, 30:] = np.linspace(1, 0, 70)

# Create the figure and image
# Note that the absolute values may be slightly different
fig, ax = plt.subplots()
ax.imshow(greys)
ax.imshow(weights, alpha=alphas, **imshow_kwargs)
ax.set_axis_off()
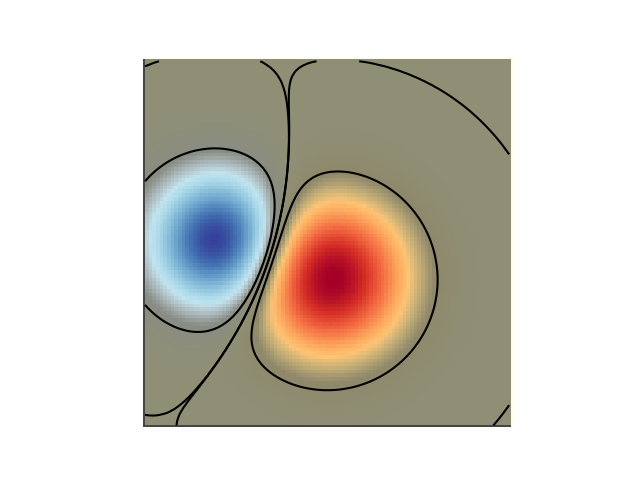
使用透明度突出显示高幅度值#
最后,我们将重新创建相同的绘图,但这次我们将使用透明度来突出显示数据中的极值.这通常用于突出显示具有较小 p 值的数据点.我们还将添加轮廓线以突出显示图像值.
# Create an alpha channel based on weight values
# Any value whose absolute value is > .0001 will have zero transparency
alphas = Normalize(0, .3, clip=True)(np.abs(weights))
alphas = np.clip(alphas, .4, 1)  # alpha value clipped at the bottom at .4

# Create the figure and image
# Note that the absolute values may be slightly different
fig, ax = plt.subplots()
ax.imshow(greys)
ax.imshow(weights, alpha=alphas, **imshow_kwargs)

# Add contour lines to further highlight different levels.
ax.contour(weights[::-1], levels=[-.1, .1], colors='k', linestyles='-')
ax.set_axis_off()
plt.show()

ax.contour(weights[::-1], levels=[-.0001, .0001], colors='k', linestyles='-')
ax.set_axis_off()
plt.show()
参考
以下函数,方法,类和模块的用法在本例中显示:
matplotlib.axes.Axes.imshow/matplotlib.pyplot.imshowmatplotlib.axes.Axes.contour/matplotlib.pyplot.contourmatplotlib.colors.Normalizematplotlib.axes.Axes.set_axis_off