备注
Go to the end 来下载完整的示例代码.
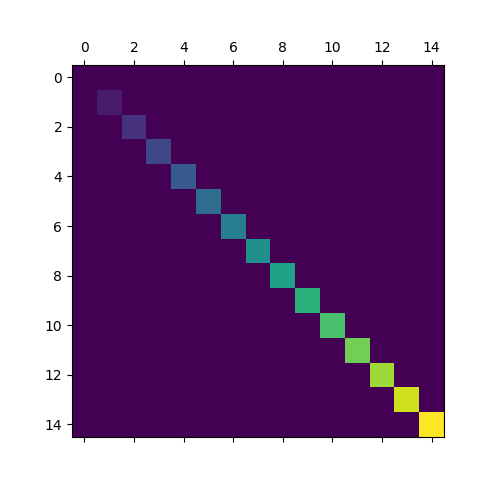
使用 matshow 可视化矩阵#
matshow 将 2D 矩阵或数组可视化为颜色编码的图像.
import matplotlib.pyplot as plt
import numpy as np

# a 2D array with linearly increasing values on the diagonal
a = np.diag(range(15))

plt.matshow(a)

plt.show()
参考
以下函数,方法,类和模块的用法在本例中显示:
matplotlib.axes.Axes.imshow/matplotlib.pyplot.imshow