备注
Go to the end 下载完整示例代码.
手动绘制轮廓#
使用 ContourSet 显示您自己的轮廓线和多边形的示例.
import matplotlib.pyplot as plt

import matplotlib.cm as cm
from matplotlib.contour import ContourSet
from matplotlib.path import Path
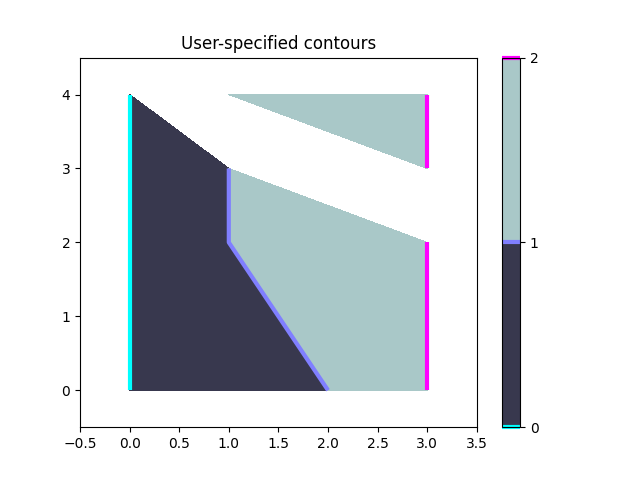
每个级别的轮廓线是多边形的列表/元组.
lines0 = [[[0, 0], [0, 4]]]
lines1 = [[[2, 0], [1, 2], [1, 3]]]
lines2 = [[[3, 0], [3, 2]], [[3, 3], [3, 4]]]  # Note two lines.
两个级别之间的填充轮廓也是多边形的列表/元组.点可以按顺时针或逆时针顺序排列.
filled01 = [[[0, 0], [0, 4], [1, 3], [1, 2], [2, 0]]]
filled12 = [[[2, 0], [3, 0], [3, 2], [1, 3], [1, 2]],   # Note two polygons.
            [[1, 4], [3, 4], [3, 3]]]
fig, ax = plt.subplots()

# Filled contours using filled=True.
cs = ContourSet(ax, [0, 1, 2], [filled01, filled12], filled=True, cmap=cm.bone)
cbar = fig.colorbar(cs)

# Contour lines (non-filled).
lines = ContourSet(
    ax, [0, 1, 2], [lines0, lines1, lines2], cmap=cm.cool, linewidths=3)
cbar.add_lines(lines)

ax.set(xlim=(-0.5, 3.5), ylim=(-0.5, 4.5),
       title='User-specified contours')
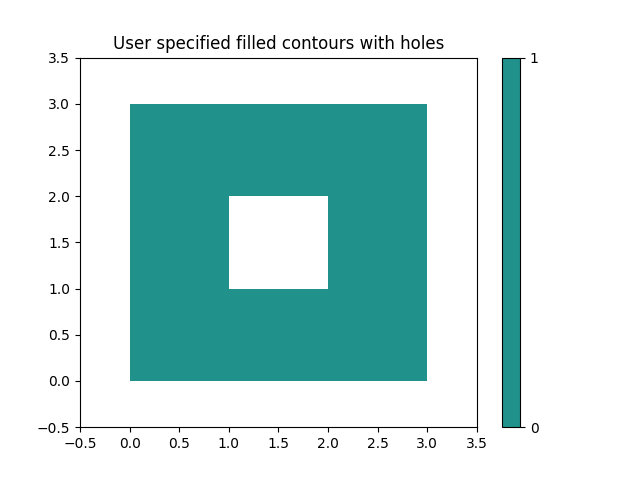
可以在单个多边形顶点列表中指定多个填充轮廓线,以及顶点种类的列表(代码类型),如 Path 类中所述.这对于带有孔的多边形特别有用.
fig, ax = plt.subplots()
filled01 = [[[0, 0], [3, 0], [3, 3], [0, 3], [1, 1], [1, 2], [2, 2], [2, 1]]]
M = Path.MOVETO
L = Path.LINETO
kinds01 = [[M, L, L, L, M, L, L, L]]
cs = ContourSet(ax, [0, 1], [filled01], [kinds01], filled=True)
cbar = fig.colorbar(cs)

ax.set(xlim=(-0.5, 3.5), ylim=(-0.5, 3.5),
       title='User specified filled contours with holes')

plt.show()