备注
Go to the end 下载完整的示例代码.
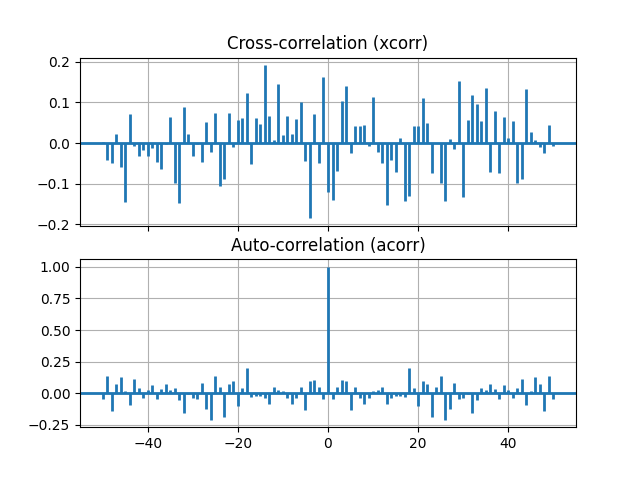
互相关和自相关#
互相关 ( xcorr ) 和自相关 ( acorr ) 图的示例用法.
import matplotlib.pyplot as plt
import numpy as np

# Fixing random state for reproducibility
np.random.seed(19680801)


x, y = np.random.randn(2, 100)
fig, [ax1, ax2] = plt.subplots(2, 1, sharex=True)
ax1.xcorr(x, y, usevlines=True, maxlags=50, normed=True, lw=2)
ax1.grid(True)
ax1.set_title('Cross-correlation (xcorr)')

ax2.acorr(x, usevlines=True, normed=True, maxlags=50, lw=2)
ax2.grid(True)
ax2.set_title('Auto-correlation (acorr)')

plt.show()
参考
以下函数,方法,类和模块的用法在本例中显示:
matplotlib.axes.Axes.acorr/matplotlib.pyplot.acorrmatplotlib.axes.Axes.xcorr/matplotlib.pyplot.xcorr