备注
Go to the end 下载完整的示例代码.
简单绘图#
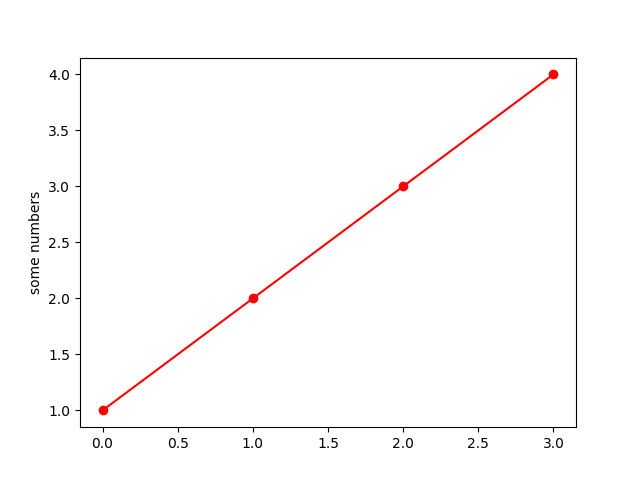
一个简单的绘图,其中一个数字列表根据它们的索引绘制,从而产生一条直线.使用格式字符串(这里是 "o-r")来设置标记(圆圈),线条样式(实线)和颜色(红色).
import matplotlib.pyplot as plt

plt.plot([1, 2, 3, 4], 'o-r')
plt.ylabel('some numbers')
plt.show()
参考
以下函数,方法,类和模块的用法在本例中显示:
matplotlib.pyplot.plotmatplotlib.pyplot.ylabelmatplotlib.pyplot.show