备注
Go to the end 下载完整的示例代码.
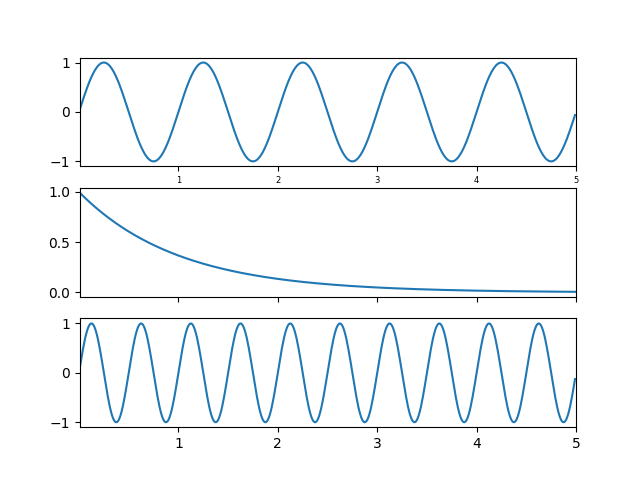
共享轴#
您可以通过传递一个 Axes 实例作为 sharex 或 sharey 关键字参数,来共享一个轴与另一个轴的 x 或 y 轴的范围.
在一个 Axes 上更改轴的范围将自动反映在另一个 Axes 上,反之亦然,因此当您使用工具栏导航时,这些 Axes 将在它们的共享轴上相互跟随.轴刻度的变化(例如,对数与线性)也是如此. 但是,刻度标签可以存在差异,例如,您可以选择性地关闭一个 Axes 上的刻度标签.
下面的示例展示了如何自定义各种轴上的刻度标签.共享轴共享刻度定位器,刻度格式化器,视图范围和转换(例如,对数,线性).但是刻度标签本身不共享属性.这是一个特性而不是一个错误,因为您可能希望在上部轴上使刻度标签更小,例如,在下面的示例中.
如果您想关闭给定 Axes 的刻度标签(例如,在 subplot(211) 或 subplot(212) 上),您不能使用标准技巧:
setp(ax2, xticklabels=[])
因为这会更改刻度 Formatter,而刻度 Formatter 在所有 Axes 之间共享.但是您可以更改标签的可见性,这是一个属性:
setp(ax2.get_xticklabels(), visible=False)
import matplotlib.pyplot as plt
import numpy as np

t = np.arange(0.01, 5.0, 0.01)
s1 = np.sin(2 * np.pi * t)
s2 = np.exp(-t)
s3 = np.sin(4 * np.pi * t)

ax1 = plt.subplot(311)
plt.plot(t, s1)
plt.tick_params('x', labelsize=6)

# share x only
ax2 = plt.subplot(312, sharex=ax1)
plt.plot(t, s2)
# make these tick labels invisible
plt.tick_params('x', labelbottom=False)

# share x and y
ax3 = plt.subplot(313, sharex=ax1, sharey=ax1)
plt.plot(t, s3)
plt.xlim(0.01, 5.0)
plt.show()