备注
Go to the end 下载完整的示例代码.
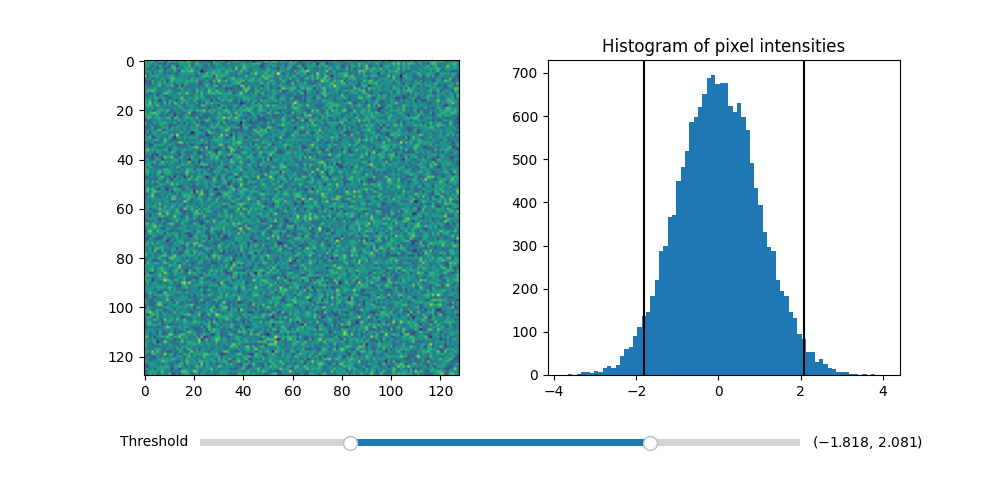
使用 RangeSlider 进行图像缩放#
使用 RangeSlider 部件来控制图像的阈值处理.
RangeSlider 部件的使用方式与 widgets.Slider 部件类似.主要的区别在于 RangeSlider 的 val 属性是一个浮点数元组 (lower val, upper val) ,而不是单个浮点数.
有关使用 Slider 控制单个浮点数的示例,请参见 滑块 .
有关让 Slider 吸附到离散值的示例,请参见 将滑块捕捉到离散值 .
import matplotlib.pyplot as plt
import numpy as np

from matplotlib.widgets import RangeSlider

# generate a fake image
np.random.seed(19680801)
N = 128
img = np.random.randn(N, N)

fig, axs = plt.subplots(1, 2, figsize=(10, 5))
fig.subplots_adjust(bottom=0.25)

im = axs[0].imshow(img)
axs[1].hist(img.flatten(), bins='auto')
axs[1].set_title('Histogram of pixel intensities')

# Create the RangeSlider
slider_ax = fig.add_axes([0.20, 0.1, 0.60, 0.03])
slider = RangeSlider(slider_ax, "Threshold", img.min(), img.max())

# Create the Vertical lines on the histogram
lower_limit_line = axs[1].axvline(slider.val[0], color='k')
upper_limit_line = axs[1].axvline(slider.val[1], color='k')


def update(val):
    # The val passed to a callback by the RangeSlider will
    # be a tuple of (min, max)

    # Update the image's colormap
    im.norm.vmin = val[0]
    im.norm.vmax = val[1]

    # Update the position of the vertical lines
    lower_limit_line.set_xdata([val[0], val[0]])
    upper_limit_line.set_xdata([val[1], val[1]])

    # Redraw the figure to ensure it updates
    fig.canvas.draw_idle()


slider.on_changed(update)
plt.show()
参考
以下函数,方法,类和模块的用法在本例中显示:
matplotlib.widgets.RangeSlider