备注
Go to the end 下载完整的示例代码.
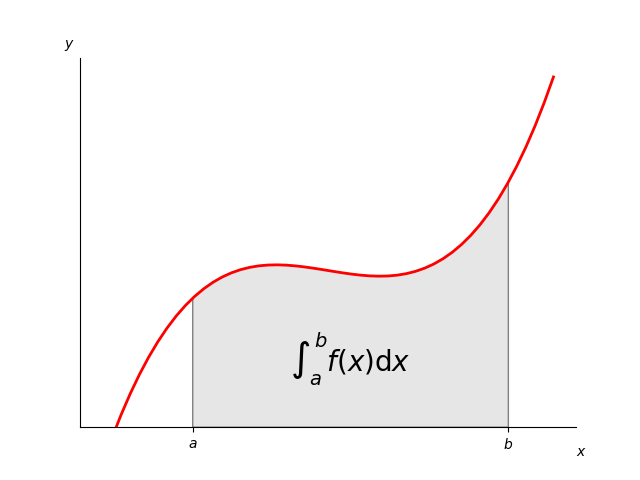
积分作为曲线下的面积#
虽然这是一个简单的示例,但它演示了一些重要的调整:
具有自定义颜色和线宽的简单折线图.
使用 Polygon 补丁创建的阴影区域.
带有 mathtext 渲染的文本标签.
用于标记 x 和 y 轴的 figtext 调用.
使用轴脊柱隐藏顶部和右侧脊柱.
自定义刻度线位置和标签.
import matplotlib.pyplot as plt
import numpy as np

from matplotlib.patches import Polygon


def func(x):
    return (x - 3) * (x - 5) * (x - 7) + 85


a, b = 2, 9  # integral limits
x = np.linspace(0, 10)
y = func(x)

fig, ax = plt.subplots()
ax.plot(x, y, 'r', linewidth=2)
ax.set_ylim(bottom=0)

# Make the shaded region
ix = np.linspace(a, b)
iy = func(ix)
verts = [(a, 0), *zip(ix, iy), (b, 0)]
poly = Polygon(verts, facecolor='0.9', edgecolor='0.5')
ax.add_patch(poly)

ax.text(0.5 * (a + b), 30, r"$\int_a^b f(x)\mathrm{d}x$",
        horizontalalignment='center', fontsize=20)

fig.text(0.9, 0.05, '$x$')
fig.text(0.1, 0.9, '$y$')

ax.spines[['top', 'right']].set_visible(False)
ax.set_xticks([a, b], labels=['$a$', '$b$'])
ax.set_yticks([])

plt.show()