备注
Go to the end 下载完整的示例代码.
管理 pyplot 中的多个图形#
matplotlib.pyplot 使用当前图形和当前 Axes 的概念.图形通过传递给 figure 的图形编号来标识.具有给定编号的图形被设置为当前图形.此外,如果不存在具有该编号的图形,则会创建一个新图形.
备注
我们不鼓励通过隐式的 pyplot 接口处理多个图形,因为管理当前图形很麻烦且容易出错.相反,我们建议使用显式方法,并在 Figure 和 Axes 实例上调用方法.有关隐式和显式接口之间权衡的说明,请参见 Matplotlib 应用程序接口 (APIs) .
import matplotlib.pyplot as plt
import numpy as np

t = np.arange(0.0, 2.0, 0.01)
s1 = np.sin(2*np.pi*t)
s2 = np.sin(4*np.pi*t)
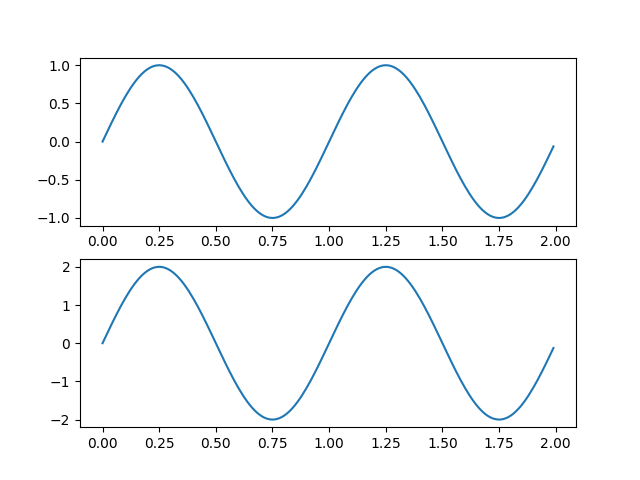
创建图形 1
plt.figure(1)
plt.subplot(211)
plt.plot(t, s1)
plt.subplot(212)
plt.plot(t, 2*s1)
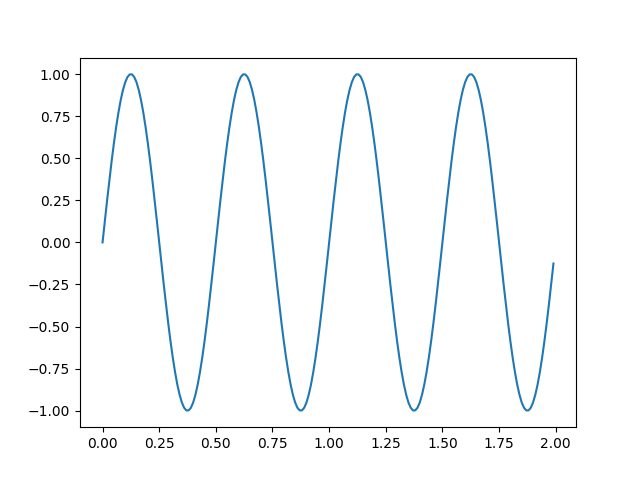
创建图形 2
plt.figure(2)
plt.plot(t, s2)
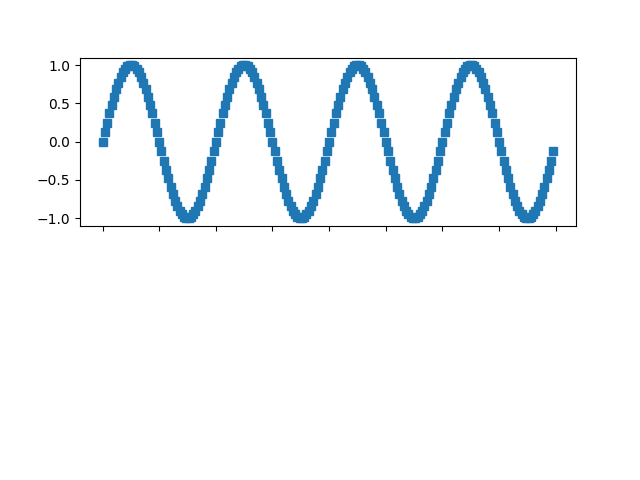
现在切换回图形 1 并进行一些更改
plt.figure(1)
plt.subplot(211)
plt.plot(t, s2, 's')
ax = plt.gca()
ax.set_xticklabels([])

plt.show()