备注
Go to the end to download the full example code..
主刻度和副刻度#
演示如何使用主刻度和副刻度.
两个相关的类是 Locator 和 Formatter .定位器确定刻度线的位置,格式化器控制刻度线标签的格式.
默认情况下,副刻度线是关闭的(使用 NullLocator 和 NullFormatter ).可以通过设置副定位器来打开不带标签的副刻度线.可以通过设置副格式化器来打开副刻度线标签.
MultipleLocator 将刻度线放置在某个基数的倍数上. StrMethodFormatter 使用格式字符串(例如, '{x:d}' 或 '{x:1.2f}' 或 '{x:1.1f} cm' )来格式化刻度线标签(格式字符串中的变量必须是 'x' ).对于 StrMethodFormatter ,可以直接将字符串传递给 Axis.set_major_formatter 或 Axis.set_minor_formatter .将自动创建并使用适当的 StrMethodFormatter .
pyplot.grid 会同时更改 x 轴和 y 轴主刻度的网格设置.如果要控制给定轴的次刻度网格,请使用以下示例:
ax.xaxis.grid(True, which='minor')
请注意,给定的定位器或格式化器实例只能用于单个轴(因为定位器存储对轴数据和视图限制的引用).
import matplotlib.pyplot as plt
import numpy as np
from matplotlib.ticker import AutoMinorLocator, MultipleLocator
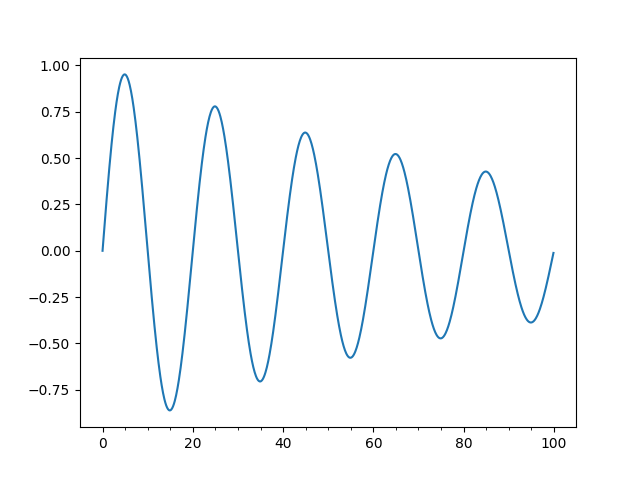
t = np.arange(0.0, 100.0, 0.1)
s = np.sin(0.1 * np.pi * t) * np.exp(-t * 0.01)
fig, ax = plt.subplots()
ax.plot(t, s)
# Make a plot with major ticks that are multiples of 20 and minor ticks that
# are multiples of 5. Label major ticks with '.0f' formatting but don't label
# minor ticks. The string is used directly, the `StrMethodFormatter` is
# created automatically.
ax.xaxis.set_major_locator(MultipleLocator(20))
ax.xaxis.set_major_formatter('{x:.0f}')
# For the minor ticks, use no labels; default NullFormatter.
ax.xaxis.set_minor_locator(MultipleLocator(5))
plt.show()
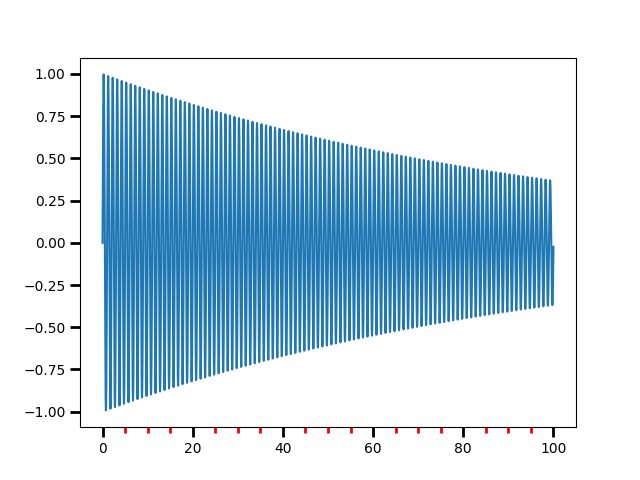
自动选择主刻度和次刻度.
使用交互式平移和缩放来查看刻度间隔如何变化.每个主间隔将有 4 个或 5 个次刻度间隔,具体取决于主间隔.
可以向 AutoMinorLocator 提供一个参数来指定每个主间隔的固定数量的次间隔,例如 AutoMinorLocator(2) 将导致主刻度之间有一个次刻度.
t = np.arange(0.0, 100.0, 0.01)
s = np.sin(2 * np.pi * t) * np.exp(-t * 0.01)

fig, ax = plt.subplots()
ax.plot(t, s)

ax.xaxis.set_minor_locator(AutoMinorLocator())

ax.tick_params(which='both', width=2)
ax.tick_params(which='major', length=7)
ax.tick_params(which='minor', length=4, color='r')

plt.show()
参考
以下函数,方法,类和模块的用法在本例中显示:
matplotlib.pyplot.subplotsmatplotlib.axis.Axis.set_major_formattermatplotlib.axis.Axis.set_major_locatormatplotlib.axis.Axis.set_minor_locatormatplotlib.ticker.AutoMinorLocatormatplotlib.ticker.MultipleLocatormatplotlib.ticker.StrMethodFormatter