备注
Go to the end 下载完整的示例代码.
多层(嵌套)刻度#
有时我们希望在轴上添加另一层刻度标签,可能为了指示刻度的分组.
Matplotlib 没有提供自动执行此操作的方法,但是在主轴下方添加注释相对简单.
这些示例使用 Axes.secondary_xaxis ,这是一种方法.它的优点是我们可以在执行分组的轴上使用 Matplotlib 定位器和格式化器(如果需要).
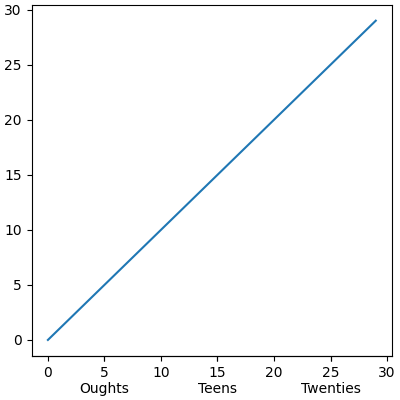
第一个示例创建了一个辅助 xaxis,并使用 Axes.set_xticks 手动添加了刻度和标签.请注意,刻度标签在开头有一个换行符(例如 " Oughts" ),以将第二层刻度标签置于主刻度标签之下.
import matplotlib.pyplot as plt
import numpy as np

import matplotlib.dates as mdates

rng = np.random.default_rng(19680801)

fig, ax = plt.subplots(layout='constrained', figsize=(4, 4))

ax.plot(np.arange(30))

sec = ax.secondary_xaxis(location=0)
sec.set_xticks([5, 15, 25], labels=['\nOughts', '\nTeens', '\nTwenties'])
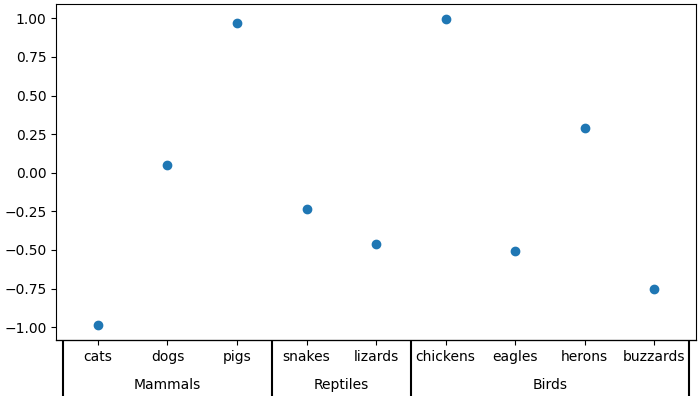
第二个示例向分类轴添加了第二层注释.在这里,我们需要注意每个动物(类别)都分配了一个整数,因此 cats 在 x=0, dogs 在 x=1 等.然后,我们将第二层的刻度放置在我们试图描绘的动物类别的中间的 x 上.
此示例还通过添加第二个辅助 xaxis 并在动物类别之间的边界处放置长而宽的刻度线来在类别之间添加刻度线标记.
fig, ax = plt.subplots(layout='constrained', figsize=(7, 4))

ax.plot(['cats', 'dogs', 'pigs', 'snakes', 'lizards', 'chickens',
         'eagles', 'herons', 'buzzards'],
        rng.normal(size=9), 'o')

# label the classes:
sec = ax.secondary_xaxis(location=0)
sec.set_xticks([1, 3.5, 6.5], labels=['\n\nMammals', '\n\nReptiles', '\n\nBirds'])
sec.tick_params('x', length=0)

# lines between the classes:
sec2 = ax.secondary_xaxis(location=0)
sec2.set_xticks([-0.5, 2.5, 4.5, 8.5], labels=[])
sec2.tick_params('x', length=40, width=1.5)
ax.set_xlim(-0.6, 8.6)
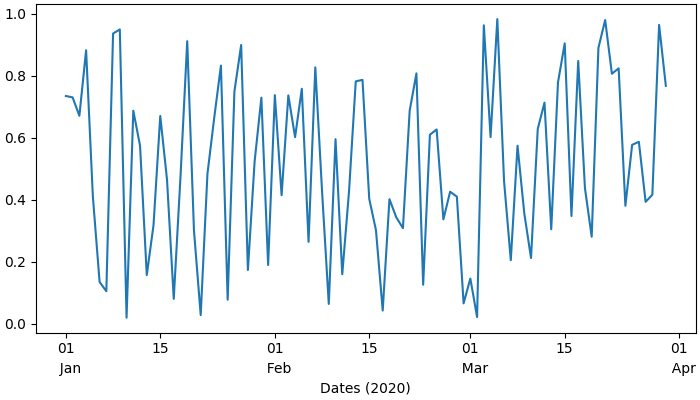
日期是另一个我们可能希望具有第二层刻度标签的常见位置.在最后一个示例中,我们利用了向辅助 xaxis 添加自动定位器和格式化器的能力,这意味着我们不需要手动设置刻度.
此示例也与上述示例不同,因为它位于主轴下方 location=-0.075 的位置,然后我们通过将线宽设置为零来隐藏脊柱.这意味着我们的格式化程序不再需要前两个示例的回车符.
fig, ax = plt.subplots(layout='constrained', figsize=(7, 4))

time = np.arange(np.datetime64('2020-01-01'), np.datetime64('2020-03-31'),
                 np.timedelta64(1, 'D'))

ax.plot(time, rng.random(size=len(time)))

# just format the days:
ax.xaxis.set_major_formatter(mdates.DateFormatter('%d'))

# label the months:
sec = ax.secondary_xaxis(location=-0.075)
sec.xaxis.set_major_locator(mdates.MonthLocator(bymonthday=1))

# note the extra spaces in the label to align the month label inside the month.
# Note that this could have been done by changing ``bymonthday`` above as well:
sec.xaxis.set_major_formatter(mdates.DateFormatter('  %b'))
sec.tick_params('x', length=0)
sec.spines['bottom'].set_linewidth(0)

# label the xaxis, but note for this to look good, it needs to be on the
# secondary xaxis.
sec.set_xlabel('Dates (2020)')

plt.show()
该脚本的总运行时间:(0 分钟 1.254 秒)