axisartist 工具包#
警告
axisartist 使用自定义的 Axes 类(派生自 Matplotlib 的原始 Axes 类).作为副作用,某些命令(主要与刻度相关)不起作用.
axisartist 包含一个自定义的 Axes 类,旨在支持曲线网格(例如,天文学中的世界坐标系).与 Matplotlib 的原始 Axes 类使用 Axes.xaxis 和 Axes.yaxis 绘制刻度,刻度线等不同,axisartist 使用特殊的 artist (AxisArtist),它可以处理弯曲坐标系的刻度,刻度线等.
由于它使用特殊的 artist,因此某些适用于 Axes.xaxis 和 Axes.yaxis 的 Matplotlib 命令可能不起作用.
axisartist#
axisartist 模块提供了一个自定义的(并且是非常实验性的)Axes 类,其中每个轴(左,右,上和下)都有一个单独的关联 artist,它负责绘制轴线,刻度,刻度标签和标签.您还可以创建自己的轴,该轴可以通过轴坐标中的固定位置或数据坐标中的固定位置(即,当 viewlimit 更改时,轴会浮动).
默认情况下,axes 类具有不可见的 xaxis 和 yaxis,并且有 4 个额外的 artist 负责绘制"左","右","下"和"上"中的 4 个轴脊.可以将其作为 ax.axis["left"],ax.axis["right"] 等进行访问,即 ax.axis 是一个包含 artist 的字典(请注意,ax.axis 仍然是一个可调用方法,它的行为类似于 Matplotlib 中的原始 Axes.axis 方法).
要创建一个 Axes,请执行以下操作:
import mpl_toolkits.axisartist as AA
fig = plt.figure()
fig.add_axes([0.1, 0.1, 0.8, 0.8], axes_class=AA.Axes)
或者创建一个子图:
fig.add_subplot(111, axes_class=AA.Axes)
# Given that 111 is the default, one can also do
fig.add_subplot(axes_class=AA.Axes)
例如,您可以使用以下命令隐藏右侧和顶部的脊:
ax.axis["right"].set_visible(False)
ax.axis["top"].set_visible(False)
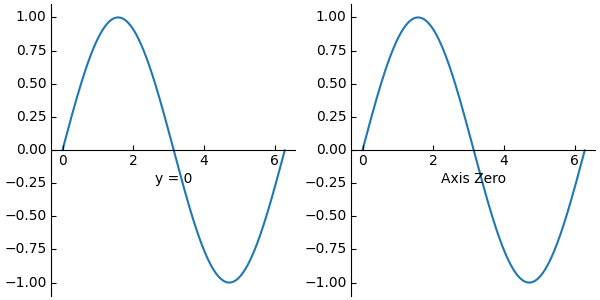
也可以添加一个水平轴.例如,您可能有一个位于 y=0 的水平轴(在数据坐标中).:
ax.axis["y=0"] = ax.new_floating_axis(nth_coord=0, value=0)
或者一个具有某些偏移量的固定轴:
# make new (right-side) yaxis, but with some offset
ax.axis["right2"] = ax.new_fixed_axis(loc="right", offset=(20, 0))
带有 ParasiteAxes 的 axisartist#
axes_grid1 工具包中的大多数命令都可以使用 axes_class 关键字参数,并且这些命令会创建一个给定类的 Axes.例如,要创建一个带有 axisartist.Axes 的主子图,请执行以下操作:
import mpl_toolkits.axisartist as AA
from mpl_toolkits.axes_grid1 import host_subplot

host = host_subplot(111, axes_class=AA.Axes)
这是一个使用 ParasiteAxes 的示例.
曲线网格#
AxisArtist 模块的动机是支持曲线网格和刻度.
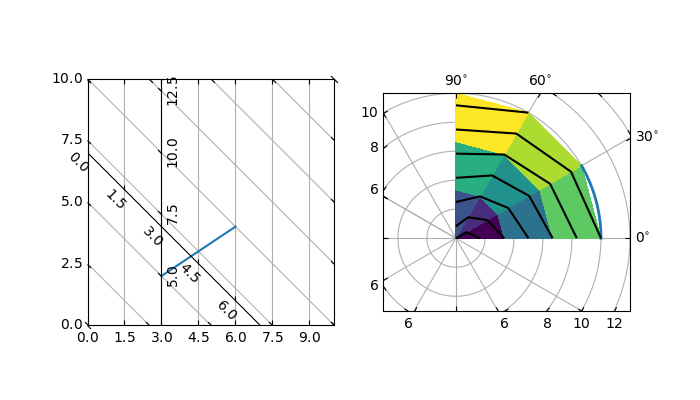
浮动坐标轴#
AxisArtist 也支持浮动坐标轴,其外部坐标轴被定义为浮动轴.
axisartist 命名空间#
axisartist 命名空间包含一个派生的 Axes 实现.最大的区别在于,负责绘制轴线,刻度,刻度标签和轴标签的 artists 与 Matplotlib 的 Axis 类分离,后者比原始 Matplotlib 中的 artists 多得多.这种改变的主要动机是支持曲线网格.以下是 mpl_toolkits.axisartist.Axes 与 Matplotlib 的原始 Axes 的一些不同之处.
轴元素(轴线(spine),刻度,刻度标签和轴标签)由 AxisArtist 实例绘制.与 Axis 不同,左,右,上和下轴由单独的 artists 绘制.并且它们中的每一个可能具有不同的刻度位置和不同的刻度标签.
网格线由 Gridlines 实例绘制.这种改变的动机是,在曲线坐标中,网格线可能不会穿过轴线(即,没有相关的刻度).在原始的 Axes 类中,网格线与刻度相关联.
如果需要,可以旋转刻度线(即,沿着网格线)
总而言之,所有这些更改都是为了支持
曲线网格.
浮动轴
mpl_toolkits.axisartist.Axes 类定义了一个 axis 属性,它是一个 AxisArtist 实例的字典.默认情况下,该字典有 4 个 AxisArtist 实例,负责绘制左,右,下和上轴.
xaxis 和 yaxis 属性仍然可用,但是它们被设置为不可见.由于单独的 artists 用于渲染轴,因此 Matplotlib 中的一些与轴相关的方法可能无效.除了 AxisArtist 实例之外,mpl_toolkits.axisartist.Axes 将具有 gridlines 属性 (Gridlines),它显然绘制网格线.
在 AxisArtist 和 Gridlines 中,刻度和网格位置的计算都委托给 GridHelper 类的实例. mpl_toolkits.axisartist.Axes 类使用 GridHelperRectlinear 作为网格 helper. GridHelperRectlinear 类是 Matplotlib 原始 Axes 的 xaxis 和 yaxis 的包装器,它的目的是按照 Matplotlib 原始轴的工作方式工作.例如,使用 set_ticks 方法更改刻度位置等应该按预期工作.但是,通常更改 artist 属性(例如,颜色)将不起作用,尽管已经做出了一些努力,以便尊重一些经常更改的属性(颜色等).
AxisArtist#
AxisArtist 可以被认为是一个容器 artist,具有以下将绘制刻度,标签等的属性.
line
major_ticks, major_ticklabels
minor_ticks, minor_ticklabels
offsetText
label
line#
派生自 Line2D 类.负责绘制脊柱(Spinal)(?)线.
major_ticks, minor_ticks#
派生自 Line2D 类.请注意,刻度是标记.
major_ticklabels, minor_ticklabels#
派生自 Text.请注意,它不是 Text artist 的列表,而是一个单独的 artist(类似于集合).
axislabel#
派生自 Text.
默认 AxisArtists#
默认情况下,定义了以下轴 artists.:
ax.axis["left"], ax.axis["bottom"], ax.axis["right"], ax.axis["top"]
顶部和右侧轴的刻度标签和轴标签设置为不可见.
例如,如果要更改底部 x 轴的 major_ticklabels 的颜色属性
ax.axis["bottom"].major_ticklabels.set_color("b")
同样,要使刻度标签不可见
ax.axis["bottom"].major_ticklabels.set_visible(False)
AxisArtist 提供了一个辅助方法来控制刻度,刻度标签和标签的可见性.要使刻度标签不可见,:
ax.axis["bottom"].toggle(ticklabels=False)
要使所有刻度,刻度标签和(轴)标签都不可见
ax.axis["bottom"].toggle(all=False)
要关闭所有内容但打开刻度
ax.axis["bottom"].toggle(all=False, ticks=True)
要打开所有内容但关闭(轴)标签
ax.axis["bottom"].toggle(all=True, label=False)
ax.axis 的 __getitem__ 方法可以接受多个轴名称.例如,要打开"顶部"和"右侧"轴的刻度标签
ax.axis["top", "right"].toggle(ticklabels=True)
请注意, ax.axis["top", "right"] 返回一个简单的代理对象,该对象将上面的代码转换为如下内容.:
for n in ["top", "right"]:
    ax.axis[n].toggle(ticklabels=True)
因此,for 循环中的任何返回值都将被忽略.并且你不应该将它用于比简单方法更多的用途.
就像列表索引 ":" 表示所有项目一样,即
ax.axis[:].major_ticks.set_color("r")
更改所有轴中的刻度颜色.
使用方法#
更改刻度位置和标签.
与原始 Matplotlib 的轴相同
ax.set_xticks([1, 2, 3])
更改轴的属性,例如颜色等.
更改相应绘图对象的属性.例如,要更改刻度标签的颜色:
ax.axis["left"].major_ticklabels.set_color("r")
要更改多个轴的属性:
ax.axis["left", "bottom"].major_ticklabels.set_color("r")
或者更改所有轴的属性:
ax.axis[:].major_ticklabels.set_color("r")
要更改刻度线的大小(长度),您需要使用 axis.major_ticks.set_ticksize 方法.要更改刻度线的方向(默认情况下,刻度线与刻度标签的方向相反),请使用 axis.major_ticks.set_tick_out 方法.
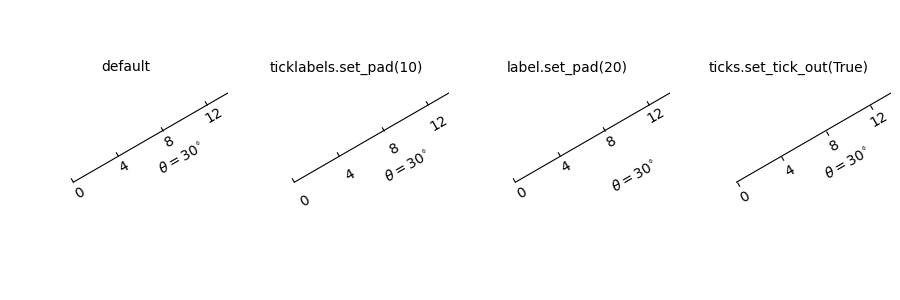
要更改刻度线和刻度标签之间的填充,请使用 axis.major_ticklabels.set_pad 方法.
要更改刻度标签和轴标签之间的填充,请使用 axis.label.set_pad 方法.
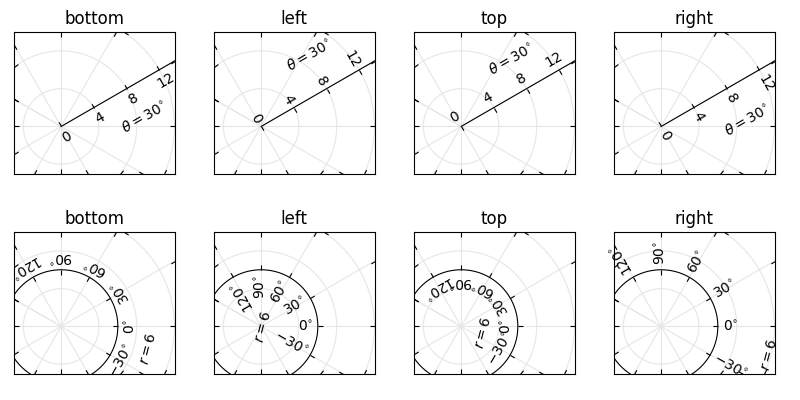
刻度标签的旋转和对齐#
这也与标准 Matplotlib 非常不同,可能会造成混淆.当您想要旋转刻度标签时,首先考虑使用 "set_axis_direction" 方法.
ax1.axis["left"].major_ticklabels.set_axis_direction("top")
ax1.axis["right"].label.set_axis_direction("left")
set_axis_direction 的参数是 ["left", "right", "bottom", "top"] 之一.
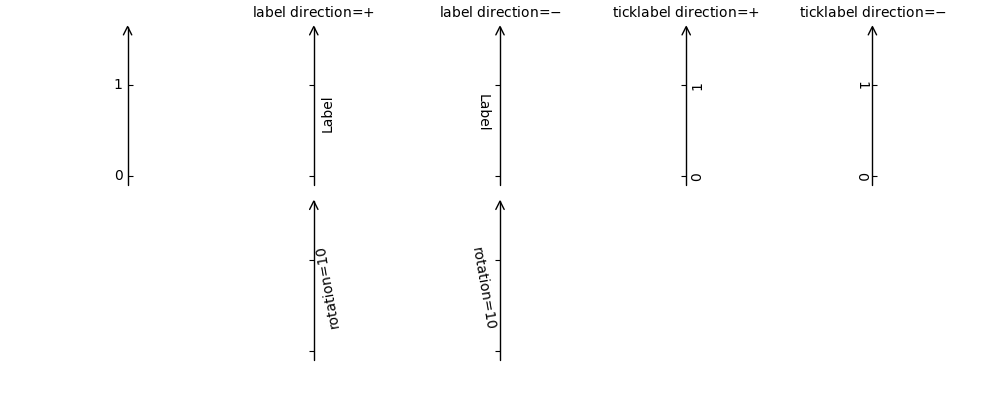
您必须理解一些方向的底层概念.
存在一个参考方向,它被定义为坐标轴线与坐标增加的方向.例如,左侧 x 轴的参考方向是从下到上.
刻度线,刻度标签和轴标签的方向,文本角度和对齐方式是相对于参考方向确定的
label_direction 和 ticklabel_direction 要么是参考方向的右侧 (+),要么是左侧 (-).
默认情况下,刻度线朝向与刻度标签相反的方向绘制.
刻度标签和标签的文本旋转是参考 ticklabel_direction 或 label_direction 确定的.刻度标签和标签的旋转是固定的.
另一方面,存在一个 "axis_direction" 的概念.这是每个 "bottom","left","top" 和 "right" 轴的上述属性的默认设置.
参考方向 |
标签方向 |
标签旋转 |
水平对齐 |
垂直对齐 |
|---|---|---|---|---|
left |
'-' |
180 |
right |
center |
bottom |
'+' |
0 |
center |
top |
right |
'+' |
0 |
right |
center |
top |
'-' |
180 |
center |
bottom |
参考方向 |
标签方向 |
标签旋转 |
水平对齐 |
垂直对齐 |
|---|---|---|---|---|
left |
'-' |
90 |
right |
center |
bottom |
'+' |
0 |
center |
baseline |
right |
'+' |
-90 |
right |
center |
top |
'-' |
180 |
center |
baseline |
并且,'set_axis_direction("top")' 意味着调整文本旋转等,以适应 "top" 轴的设置.轴方向的概念可以通过弯曲轴更清楚地理解.
axis_direction 可以在 AxisArtist 级别进行调整,也可以在其子绘图对象级别进行调整,即刻度线,刻度标签和轴标签.
ax1.axis["left"].set_axis_direction("top")
更改与 "left" 轴关联的所有绘图对象的 axis_direction,而:
ax1.axis["left"].major_ticklabels.set_axis_direction("top")
仅更改 major_ticklabels 的 axis_direction.请注意,AxisArtist 级别的 set_axis_direction 会更改 ticklabel_direction 和 label_direction,而更改刻度线,刻度标签和轴标签的 axis_direction 不会影响它们.
如果您希望刻度线向外,刻度标签在轴内,请使用 invert_ticklabel_direction 方法.
ax.axis[:].invert_ticklabel_direction()
一个相关的方法是 "set_tick_out".它使刻度线向外(实际上,它使刻度线朝向与默认方向相反的方向).
ax.axis[:].major_ticks.set_tick_out(True)
所以,总之,
AxisArtist 的方法
set_axis_direction: "left", "right", "bottom", 或 "top"
set_ticklabel_direction: "+" 或 "-"
set_axislabel_direction: "+" 或 "-"
invert_ticklabel_direction
刻度线的方法(major_ticks 和 minor_ticks)
set_tick_out: True 或 False
set_ticksize: 以磅为单位的大小
刻度标签的方法(major_ticklabels 和 minor_ticklabels)
set_axis_direction: "left", "right", "bottom", 或 "top"
set_rotation: 相对于参考方向的角度
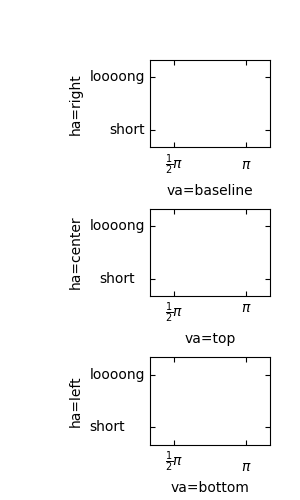
set_ha 和 set_va:见下文
轴标签的方法(label)
set_axis_direction: "left", "right", "bottom", 或 "top"
set_rotation: 相对于参考方向的角度
set_ha 和 set_va
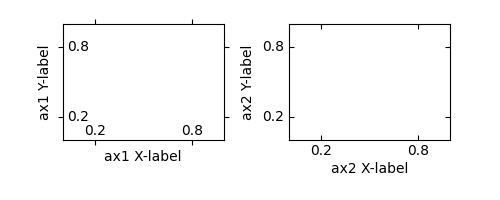
调整刻度标签的对齐方式#
刻度标签的对齐方式经过特殊处理.见下文
调整填充#
要更改刻度线和刻度标签之间的填充:
ax.axis["left"].major_ticklabels.set_pad(10)
或刻度标签和轴标签之间:
ax.axis["left"].label.set_pad(10)
GridHelper#
要实际定义曲线坐标,您必须使用自己的网格助手.提供了一个通用的网格助手类,在大多数情况下,这个类应该足够了.用户可以提供两个函数,用于定义从曲线坐标到(直线)图像坐标的转换(及其逆对).请注意,虽然为曲线坐标绘制刻度和网格,但轴本身的数据变换(ax.transData)仍然是直线(图像)坐标.
from mpl_toolkits.axisartist.grid_helper_curvelinear \
     import GridHelperCurveLinear
from mpl_toolkits.axisartist import Axes

# from curved coordinate to rectlinear coordinate.
def tr(x, y):
    x, y = np.asarray(x), np.asarray(y)
    return x, y-x

# from rectlinear coordinate to curved coordinate.
def inv_tr(x, y):
    x, y = np.asarray(x), np.asarray(y)
    return x, y+x

grid_helper = GridHelperCurveLinear((tr, inv_tr))

fig.add_subplot(axes_class=Axes, grid_helper=grid_helper)
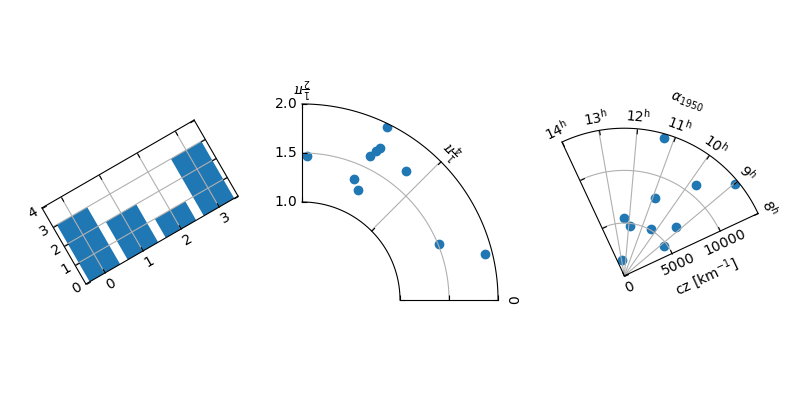
您可以使用 Matplotlib 的 Transform 实例来代替(但必须定义一个逆变换).通常,弯曲坐标系中的坐标范围可能有一个有限的范围,或者可能有循环.在这些情况下,需要一个更定制化的网格助手.
import mpl_toolkits.axisartist.angle_helper as angle_helper

# PolarAxes.PolarTransform takes radian. However, we want our coordinate
# system in degree
tr = Affine2D().scale(np.pi/180., 1.) + PolarAxes.PolarTransform()

# extreme finder: find a range of coordinate.
# 20, 20: number of sampling points along x, y direction
# The first coordinate (longitude, but theta in polar)
#   has a cycle of 360 degree.
# The second coordinate (latitude, but radius in polar)  has a minimum of 0
extreme_finder = angle_helper.ExtremeFinderCycle(20, 20,
                                                 lon_cycle=360,
                                                 lat_cycle=None,
                                                 lon_minmax=None,
                                                 lat_minmax=(0, np.inf),
                                                 )

# Find a grid values appropriate for the coordinate (degree,
# minute, second). The argument is a approximate number of grids.
grid_locator1 = angle_helper.LocatorDMS(12)

# And also uses an appropriate formatter.  Note that the acceptable Locator
# and Formatter classes are different than that of Matplotlib's, and you
# cannot directly use Matplotlib's Locator and Formatter here (but may be
# possible in the future).
tick_formatter1 = angle_helper.FormatterDMS()

grid_helper = GridHelperCurveLinear(tr,
                                    extreme_finder=extreme_finder,
                                    grid_locator1=grid_locator1,
                                    tick_formatter1=tick_formatter1
                                    )
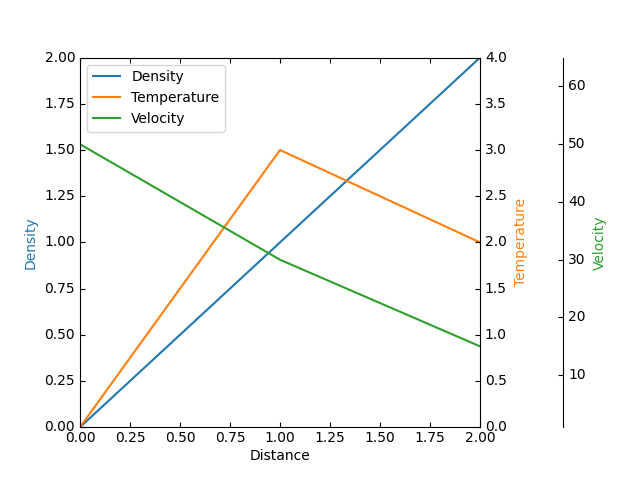
同样,坐标轴的 transData 仍然是直线坐标(图像坐标).您可以手动进行两个坐标之间的转换,或者为了方便起见,您可以使用Parasite Axes.:
ax1 = SubplotHost(fig, 1, 2, 2, grid_helper=grid_helper)

# A parasite axes with given transform
ax2 = ax1.get_aux_axes(tr, "equal")
# note that ax2.transData == tr + ax1.transData
# Anything you draw in ax2 will match the ticks and grids of ax1.
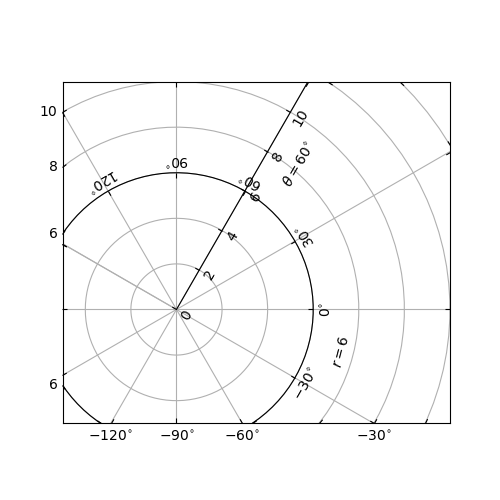
FloatingAxis#
浮动轴是其中一个数据坐标固定的轴,即,它的位置不是在 Axes 坐标中固定的,而是随着坐标轴数据限制的变化而变化.可以使用 new_floating_axis 方法创建一个浮动轴.但是,您有责任确保生成的 AxisArtist 被正确地添加到坐标轴中.推荐的方法是将其作为 Axes 的 axis 属性的一个项目添加.:
# floating axis whose first (index starts from 0) coordinate
# (theta) is fixed at 60

ax1.axis["lat"] = axis = ax1.new_floating_axis(0, 60)
axis.label.set_text(r"$\theta = 60^{\circ}$")
axis.label.set_visible(True)
请参阅此页面的第一个示例.
当前的限制和TODO#
代码需要进一步完善.这是问题和 TODO 的一个不完整列表
没有简单的方法来支持用户自定义的刻度位置(对于曲线网格).需要创建一个新的 Locator 类.
FloatingAxis 可能有坐标限制,例如,x = 0 的浮动轴,但 y 仅从 0 跨越到 1.
FloatingAxis 的 axislabel 的位置需要可选地作为坐标值给出.例如,x=0 的浮动轴,标签在 y=1 处