备注
Go to the end 以下载完整的示例代码.
轴刻度#
The x and y Axis on each Axes have default tick "locators" and "formatters"
that depend on the scale being used (see Axis 比例). It is
possible to customize the ticks and tick labels with either high-level methods
like set_xticks or set the locators and formatters directly on
the axis.
手动定位和格式#
自定义刻度位置和格式的最简单方法是使用 set_xticks 和 set_yticks .这些可以用于主刻度或副刻度.
import numpy as np
import matplotlib.pyplot as plt

import matplotlib.ticker as ticker


fig, axs = plt.subplots(2, 1, figsize=(5.4, 5.4), layout='constrained')
x = np.arange(100)
for nn, ax in enumerate(axs):
    ax.plot(x, x)
    if nn == 1:
        ax.set_title('Manual ticks')
        ax.set_yticks(np.arange(0, 100.1, 100/3))
        xticks = np.arange(0.50, 101, 20)
        xlabels = [f'\\${x:1.2f}' for x in xticks]
        ax.set_xticks(xticks, labels=xlabels)
    else:
        ax.set_title('Automatic ticks')
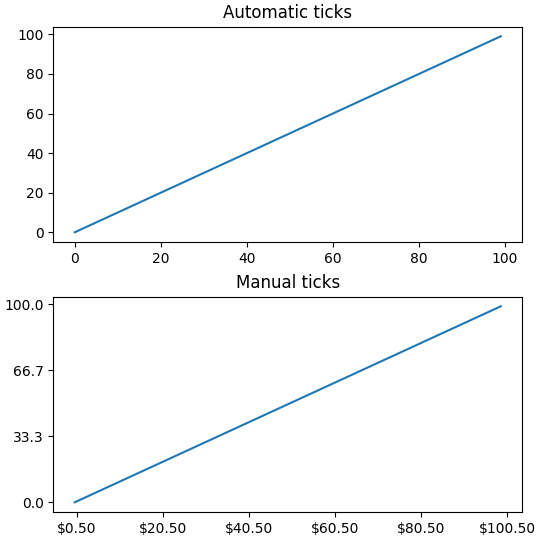
请注意, labels 参数的长度必须与用于指定刻度的数组的长度相同.
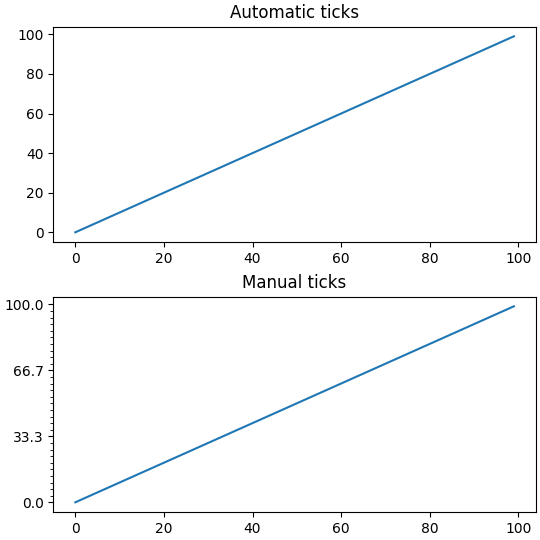
默认情况下, set_xticks 和 set_yticks 作用于轴的主刻度,但是可以添加副刻度:
fig, axs = plt.subplots(2, 1, figsize=(5.4, 5.4), layout='constrained')
x = np.arange(100)
for nn, ax in enumerate(axs):
    ax.plot(x, x)
    if nn == 1:
        ax.set_title('Manual ticks')
        ax.set_yticks(np.arange(0, 100.1, 100/3))
        ax.set_yticks(np.arange(0, 100.1, 100/30), minor=True)
    else:
        ax.set_title('Automatic ticks')
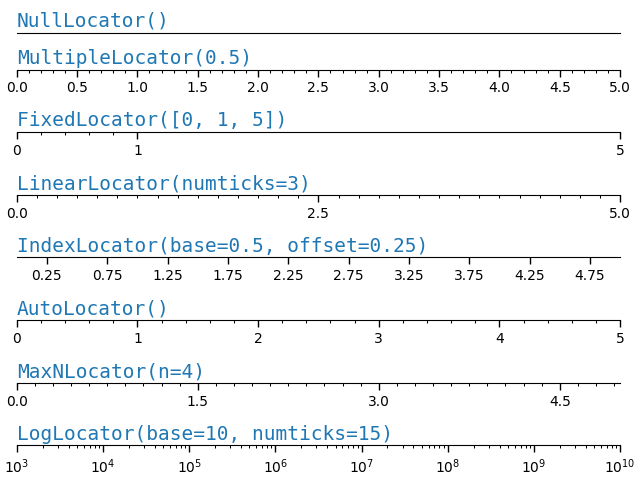
定位器和格式化器#
如上所述手动设置刻度对于特定的最终绘图效果很好,但不会随着用户与 Axes 的交互而改变.在较低的层面上,Matplotlib 具有 Locators ,旨在根据轴的当前视图限制自动选择刻度,而 Formatters 旨在自动格式化刻度标签.
Matplotlib 提供的完整定位器列表请参见 locators ,格式化器列表请参见 formatters .
def setup(ax, title):
    """Set up common parameters for the Axes in the example."""
    # only show the bottom spine
    ax.yaxis.set_major_locator(ticker.NullLocator())
    ax.spines[['left', 'right', 'top']].set_visible(False)

    ax.xaxis.set_ticks_position('bottom')
    ax.tick_params(which='major', width=1.00, length=5)
    ax.tick_params(which='minor', width=0.75, length=2.5)
    ax.set_xlim(0, 5)
    ax.set_ylim(0, 1)
    ax.text(0.0, 0.2, title, transform=ax.transAxes,
            fontsize=14, fontname='Monospace', color='tab:blue')


fig, axs = plt.subplots(8, 1, layout='constrained')

# Null Locator
setup(axs[0], title="NullLocator()")
axs[0].xaxis.set_major_locator(ticker.NullLocator())
axs[0].xaxis.set_minor_locator(ticker.NullLocator())

# Multiple Locator
setup(axs[1], title="MultipleLocator(0.5)")
axs[1].xaxis.set_major_locator(ticker.MultipleLocator(0.5))
axs[1].xaxis.set_minor_locator(ticker.MultipleLocator(0.1))

# Fixed Locator
setup(axs[2], title="FixedLocator([0, 1, 5])")
axs[2].xaxis.set_major_locator(ticker.FixedLocator([0, 1, 5]))
axs[2].xaxis.set_minor_locator(ticker.FixedLocator(np.linspace(0.2, 0.8, 4)))

# Linear Locator
setup(axs[3], title="LinearLocator(numticks=3)")
axs[3].xaxis.set_major_locator(ticker.LinearLocator(3))
axs[3].xaxis.set_minor_locator(ticker.LinearLocator(31))

# Index Locator
setup(axs[4], title="IndexLocator(base=0.5, offset=0.25)")
axs[4].plot(range(0, 5), [0]*5, color='white')
axs[4].xaxis.set_major_locator(ticker.IndexLocator(base=0.5, offset=0.25))

# Auto Locator
setup(axs[5], title="AutoLocator()")
axs[5].xaxis.set_major_locator(ticker.AutoLocator())
axs[5].xaxis.set_minor_locator(ticker.AutoMinorLocator())

# MaxN Locator
setup(axs[6], title="MaxNLocator(n=4)")
axs[6].xaxis.set_major_locator(ticker.MaxNLocator(4))
axs[6].xaxis.set_minor_locator(ticker.MaxNLocator(40))

# Log Locator
setup(axs[7], title="LogLocator(base=10, numticks=15)")
axs[7].set_xlim(10**3, 10**10)
axs[7].set_xscale('log')
axs[7].xaxis.set_major_locator(ticker.LogLocator(base=10, numticks=15))
plt.show()
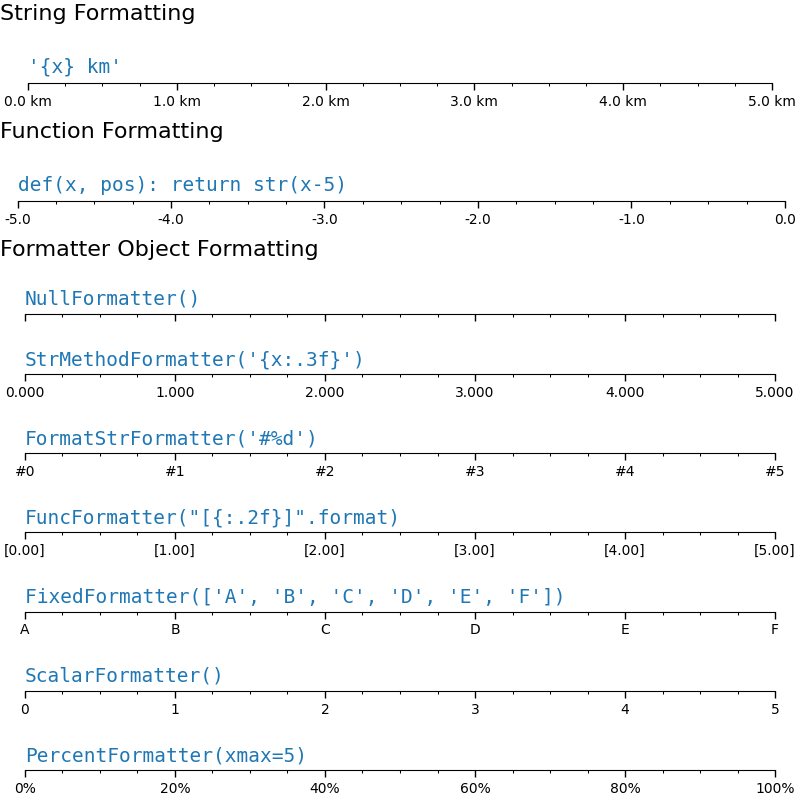
类似地,我们可以为每个轴上的主刻度和副刻度指定"格式化器".
刻度格式通过函数 set_major_formatter 或 set_minor_formatter 配置.它接受:
格式字符串,它隐式地创建一个
StrMethodFormatter.函数,隐式地创建一个
FuncFormatter.Formatter子类的实例.最常见的是NullFormatter:刻度上没有标签.StrMethodFormatter:使用字符串str.format方法.FormatStrFormatter:使用 %-style 格式.FuncFormatter:通过函数定义标签.FixedFormatter:显式设置标签字符串.ScalarFormatter:标量的默认格式化器:自动选择格式字符串.PercentFormatter:将标签格式化为百分比.
有关完整列表,请参见 formatters .
def setup(ax, title):
    """Set up common parameters for the Axes in the example."""
    # only show the bottom spine
    ax.yaxis.set_major_locator(ticker.NullLocator())
    ax.spines[['left', 'right', 'top']].set_visible(False)

    # define tick positions
    ax.xaxis.set_major_locator(ticker.MultipleLocator(1.00))
    ax.xaxis.set_minor_locator(ticker.MultipleLocator(0.25))

    ax.xaxis.set_ticks_position('bottom')
    ax.tick_params(which='major', width=1.00, length=5)
    ax.tick_params(which='minor', width=0.75, length=2.5, labelsize=10)
    ax.set_xlim(0, 5)
    ax.set_ylim(0, 1)
    ax.text(0.0, 0.2, title, transform=ax.transAxes,
            fontsize=14, fontname='Monospace', color='tab:blue')


fig = plt.figure(figsize=(8, 8), layout='constrained')
fig0, fig1, fig2 = fig.subfigures(3, height_ratios=[1.5, 1.5, 7.5])

fig0.suptitle('String Formatting', fontsize=16, x=0, ha='left')
ax0 = fig0.subplots()

setup(ax0, title="'{x} km'")
ax0.xaxis.set_major_formatter('{x} km')

fig1.suptitle('Function Formatting', fontsize=16, x=0, ha='left')
ax1 = fig1.subplots()

setup(ax1, title="def(x, pos): return str(x-5)")
ax1.xaxis.set_major_formatter(lambda x, pos: str(x-5))

fig2.suptitle('Formatter Object Formatting', fontsize=16, x=0, ha='left')
axs2 = fig2.subplots(7, 1)

setup(axs2[0], title="NullFormatter()")
axs2[0].xaxis.set_major_formatter(ticker.NullFormatter())

setup(axs2[1], title="StrMethodFormatter('{x:.3f}')")
axs2[1].xaxis.set_major_formatter(ticker.StrMethodFormatter("{x:.3f}"))

setup(axs2[2], title="FormatStrFormatter('#%d')")
axs2[2].xaxis.set_major_formatter(ticker.FormatStrFormatter("#%d"))


def fmt_two_digits(x, pos):
    return f'[{x:.2f}]'


setup(axs2[3], title='FuncFormatter("[{:.2f}]".format)')
axs2[3].xaxis.set_major_formatter(ticker.FuncFormatter(fmt_two_digits))

setup(axs2[4], title="FixedFormatter(['A', 'B', 'C', 'D', 'E', 'F'])")
# FixedFormatter should only be used together with FixedLocator.
# Otherwise, one cannot be sure where the labels will end up.
positions = [0, 1, 2, 3, 4, 5]
labels = ['A', 'B', 'C', 'D', 'E', 'F']
axs2[4].xaxis.set_major_locator(ticker.FixedLocator(positions))
axs2[4].xaxis.set_major_formatter(ticker.FixedFormatter(labels))

setup(axs2[5], title="ScalarFormatter()")
axs2[5].xaxis.set_major_formatter(ticker.ScalarFormatter(useMathText=True))

setup(axs2[6], title="PercentFormatter(xmax=5)")
axs2[6].xaxis.set_major_formatter(ticker.PercentFormatter(xmax=5))
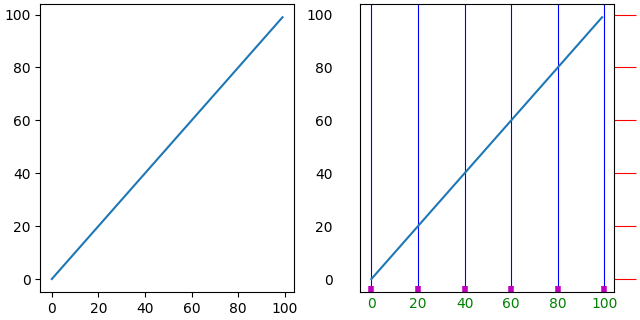
样式刻度(刻度参数)#
可以通过找到轴上的单个 Tick 在较低级别控制刻度的外观.但是,通常最简单的方法是使用 tick_params 一次性更改所有对象.
tick_params 方法可以更改刻度的属性:
长度
方向(在框架内部或外部)
颜色
宽度和长度
以及刻度是否绘制在
Axes的底部,顶部,左侧或右侧.
它还可以控制刻度标签:
labelsize(字体大小)
labelcolor(标签颜色)
labelrotation
labelbottom,labeltop,labelleft,labelright
此外,还有一个 pad 关键字参数,用于指定刻度标签与刻度之间的距离.
最后,可以设置网格线样式:
grid_color
grid_alpha
grid_linewidth
grid_linestyle
所有这些属性可以限制为一个轴,并且可以仅应用于主刻度或副刻度
fig, axs = plt.subplots(1, 2, figsize=(6.4, 3.2), layout='constrained')

for nn, ax in enumerate(axs):
    ax.plot(np.arange(100))
    if nn == 1:
        ax.grid('on')
        ax.tick_params(right=True, left=False, axis='y', color='r', length=16,
                       grid_color='none')
        ax.tick_params(axis='x', color='m', length=4, direction='in', width=4,
                       labelcolor='g', grid_color='b')
脚本的总运行时间:(0 分钟 3.884 秒)