备注
Go to the end 下载完整的示例代码.
自定义颜色条教程#
本教程展示了如何构建和自定义独立的颜色条,即没有附加的绘图.
colorbar 需要一个 "mappable" ( matplotlib.cm.ScalarMappable ) 对象(通常是一个图像),它指示要使用的颜色映射和范数.为了创建一个没有附加图像的颜色条,可以改为使用一个没有关联数据的 ScalarMappable .
import matplotlib.pyplot as plt
import matplotlib as mpl
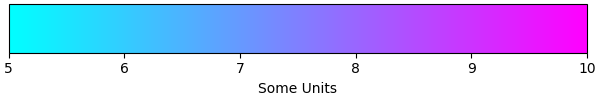
基本连续颜色条#
这里,我们创建一个带有刻度和标签的基本连续颜色条.
colorbar 调用的参数是 ScalarMappable (使用 norm 和 cmap 参数构造),应该绘制颜色条的轴,以及颜色条的方向.
有关更多信息,请参见 colorbar API.
fig, ax = plt.subplots(figsize=(6, 1), layout='constrained')

cmap = mpl.cm.cool
norm = mpl.colors.Normalize(vmin=5, vmax=10)

fig.colorbar(mpl.cm.ScalarMappable(norm=norm, cmap=cmap),
             cax=ax, orientation='horizontal', label='Some Units')
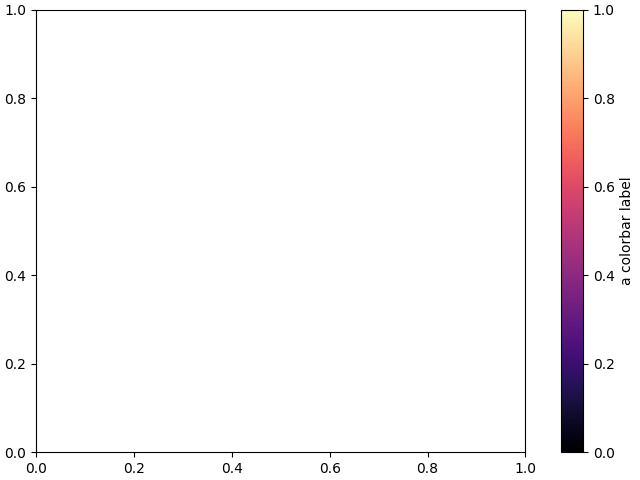
附加到预先存在的轴旁边的颜色条#
本教程中的所有示例(除了这个)都显示了其自身图形上的独立颜色条,但是可以通过将 ax=ax 传递给 colorbar() 调用(意思是"在 ax 旁边绘制颜色条")而不是 cax=ax (意思是"在 ax 上绘制颜色条"),来将颜色条显示在预先存在的 Axes ax 旁边.
fig, ax = plt.subplots(layout='constrained')

fig.colorbar(mpl.cm.ScalarMappable(norm=mpl.colors.Normalize(0, 1), cmap='magma'),
             ax=ax, orientation='vertical', label='a colorbar label')
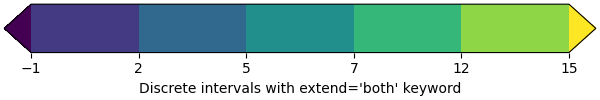
具有连续颜色刻度的离散和扩展颜色条#
以下示例展示了如何基于连续 cmap 创建离散的颜色条.我们使用 matplotlib.colors.BoundaryNorm 来描述间隔边界(必须按递增顺序排列),并进一步传递 extend 参数,以进一步显示"超出"和"低于"颜色(用于范数范围之外的数据).
fig, ax = plt.subplots(figsize=(6, 1), layout='constrained')

cmap = mpl.cm.viridis
bounds = [-1, 2, 5, 7, 12, 15]
norm = mpl.colors.BoundaryNorm(bounds, cmap.N, extend='both')

fig.colorbar(mpl.cm.ScalarMappable(norm=norm, cmap=cmap),
             cax=ax, orientation='horizontal',
             label="Discrete intervals with extend='both' keyword")
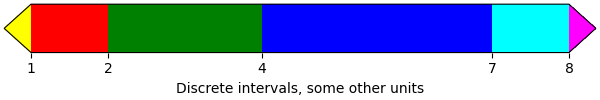
具有任意颜色的颜色条#
以下示例仍然使用 BoundaryNorm 来描述离散的间隔边界,但现在使用 matplotlib.colors.ListedColormap 将每个间隔与任意颜色相关联(必须有与颜色一样多的间隔)."超出"和"低于"颜色使用 Colormap.with_extremes 在 colormap 上设置.
我们还将其他参数传递给 colorbar :
为了在颜色条上显示超出范围的值,我们在 colorbar() 调用中使用 extend 参数.(这等效于在
BoundaryNorm构造函数中传递 extend 参数,如前面的示例所示.)为了使每个颜色条段的长度与其对应的间隔成比例,我们在 colorbar() 调用中使用 spacing 参数.
fig, ax = plt.subplots(figsize=(6, 1), layout='constrained')

cmap = (mpl.colors.ListedColormap(['red', 'green', 'blue', 'cyan'])
        .with_extremes(under='yellow', over='magenta'))
bounds = [1, 2, 4, 7, 8]
norm = mpl.colors.BoundaryNorm(bounds, cmap.N)

fig.colorbar(
    mpl.cm.ScalarMappable(cmap=cmap, norm=norm),
    cax=ax, orientation='horizontal',
    extend='both',
    spacing='proportional',
    label='Discrete intervals, some other units',
)
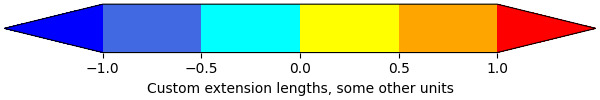
具有自定义扩展长度的颜色条#
我们可以自定义具有离散间隔的颜色条上的长度颜色条扩展. 为了使每个扩展的长度与内部颜色的长度相同,请使用 extendfrac='auto' .
fig, ax = plt.subplots(figsize=(6, 1), layout='constrained')

cmap = (mpl.colors.ListedColormap(['royalblue', 'cyan', 'yellow', 'orange'])
        .with_extremes(over='red', under='blue'))
bounds = [-1.0, -0.5, 0.0, 0.5, 1.0]
norm = mpl.colors.BoundaryNorm(bounds, cmap.N)

fig.colorbar(
    mpl.cm.ScalarMappable(cmap=cmap, norm=norm),
    cax=ax, orientation='horizontal',
    extend='both', extendfrac='auto',
    spacing='uniform',
    label='Custom extension lengths, some other units',
)

plt.show()