备注
Go to the end 下载完整示例代码.
路径教程#
在 Matplotlib 可视化中定义路径.
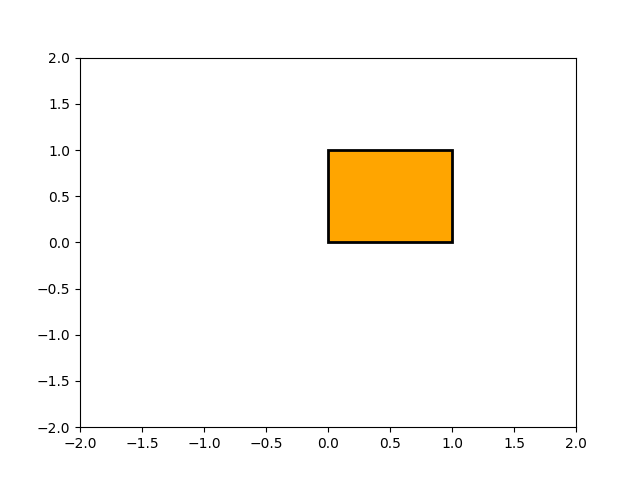
所有 matplotlib.patches 对象的基础对象是 Path ,它支持标准的 moveto,lineto,curveto 命令集,以绘制由线段和样条线组成的简单和复合轮廓. Path 使用 (N, 2) 数组 (x, y) 顶点以及 N 长度的路径代码数组实例化.例如,要绘制从 (0, 0) 到 (1, 1) 的单位矩形,我们可以使用以下代码:
import numpy as np

import matplotlib.pyplot as plt

import matplotlib.patches as patches
from matplotlib.path import Path

verts = [
   (0., 0.),  # left, bottom
   (0., 1.),  # left, top
   (1., 1.),  # right, top
   (1., 0.),  # right, bottom
   (0., 0.),  # ignored
]

codes = [
    Path.MOVETO,
    Path.LINETO,
    Path.LINETO,
    Path.LINETO,
    Path.CLOSEPOLY,
]

path = Path(verts, codes)

fig, ax = plt.subplots()
patch = patches.PathPatch(path, facecolor='orange', lw=2)
ax.add_patch(patch)
ax.set_xlim(-2, 2)
ax.set_ylim(-2, 2)
plt.show()
以下是可识别的路径代码
代码 |
顶点 |
描述 |
|---|---|---|
|
1 (忽略) |
整个路径结束的标记(当前不是必需的,将被忽略). |
|
1 |
拿起笔并移动到给定的顶点. |
|
1 |
从当前位置到给定的顶点绘制一条线. |
|
2:1 个控制点,1 个终点 |
从当前位置绘制一条二次 Bézier 曲线,使用给定的控制点到给定的终点. |
|
3:2 个控制点,1 个终点 |
从当前位置绘制一条三次 Bézier 曲线,使用给定的控制点到给定的终点. |
|
1(该点被忽略) |
绘制一条线段到当前折线的起点. |
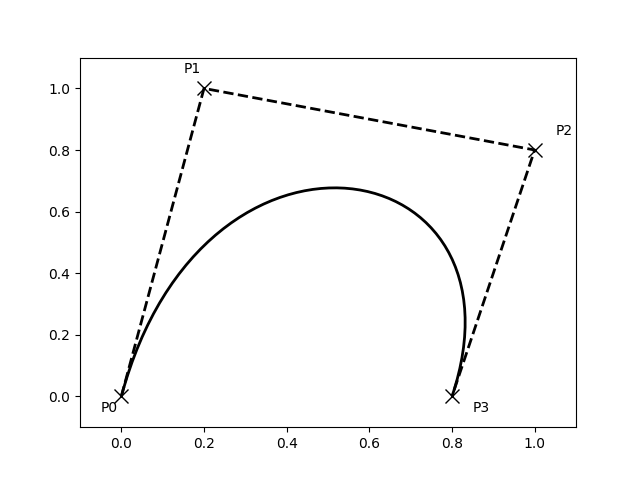
Bézier 示例#
一些路径组件需要多个顶点来指定它们:例如,CURVE 3 是一条 Bézier 曲线,具有一个控制点和一个端点,而 CURVE4 具有三个顶点,分别用于两个控制点和端点.下面的示例展示了一个 CURVE4 Bézier 样条--Bézier 曲线将包含在起点,两个控制点和端点的凸包中
verts = [
   (0., 0.),   # P0
   (0.2, 1.),  # P1
   (1., 0.8),  # P2
   (0.8, 0.),  # P3
]

codes = [
    Path.MOVETO,
    Path.CURVE4,
    Path.CURVE4,
    Path.CURVE4,
]

path = Path(verts, codes)

fig, ax = plt.subplots()
patch = patches.PathPatch(path, facecolor='none', lw=2)
ax.add_patch(patch)

xs, ys = zip(*verts)
ax.plot(xs, ys, 'x--', lw=2, color='black', ms=10)

ax.text(-0.05, -0.05, 'P0')
ax.text(0.15, 1.05, 'P1')
ax.text(1.05, 0.85, 'P2')
ax.text(0.85, -0.05, 'P3')

ax.set_xlim(-0.1, 1.1)
ax.set_ylim(-0.1, 1.1)
plt.show()
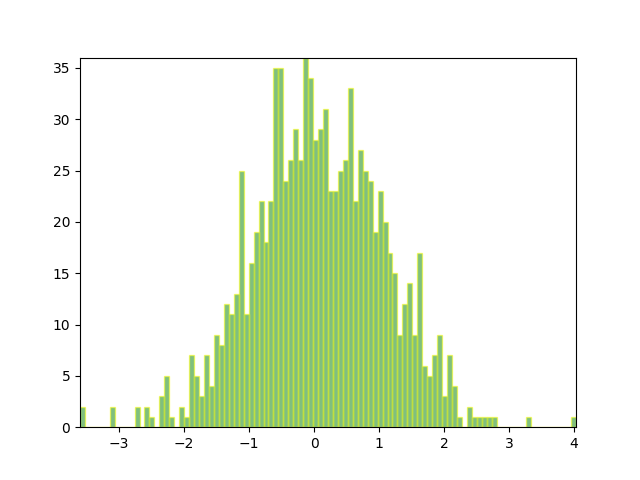
复合路径#
matplotlib 中的所有简单补丁基元,Rectangle,Circle,Polygon 等,都是使用简单路径实现的.诸如 hist() 和 bar() 之类的绘图函数会创建多个基元,例如,一堆矩形,通常可以使用复合路径更有效地实现. bar 创建矩形列表而不是复合路径的原因主要是历史原因 Path 代码相对较新,而 bar 早于它. 虽然我们现在可以更改它,但这会破坏旧代码,因此我们将在此处介绍如何创建复合路径,替换 bar 中的功能,以防您出于效率原因需要在您自己的代码中这样做,例如,您正在创建动画条形图.
我们将通过为每个直方图条创建一系列矩形来制作直方图图表:矩形宽度是 bin 宽度,矩形高度是该 bin 中数据点的数量. 首先,我们将创建一些随机正态分布数据并计算直方图. 因为 NumPy 返回 bin 边缘而不是中心,所以 bins 的长度比下面示例中 n 的长度大 1:
# histogram our data with numpy
data = np.random.randn(1000)
n, bins = np.histogram(data, 100)
我们现在将提取矩形的角. 下面的每个 left , bottom 等数组都是 len(n) ,其中 n 是每个直方图条的计数数组:
# get the corners of the rectangles for the histogram
left = np.array(bins[:-1])
right = np.array(bins[1:])
bottom = np.zeros(len(left))
top = bottom + n
现在我们必须构建我们的复合路径,它将由每个矩形的一系列 MOVETO , LINETO 和 CLOSEPOLY 组成. 对于每个矩形,我们需要五个顶点:一个用于 MOVETO ,三个用于 LINETO ,一个用于 CLOSEPOLY . 如上表所示,closepoly 的顶点被忽略,但我们仍然需要它来保持代码与顶点对齐:
nverts = nrects*(1+3+1)
verts = np.zeros((nverts, 2))
codes = np.ones(nverts, int) * path.Path.LINETO
codes[0::5] = path.Path.MOVETO
codes[4::5] = path.Path.CLOSEPOLY
verts[0::5, 0] = left
verts[0::5, 1] = bottom
verts[1::5, 0] = left
verts[1::5, 1] = top
verts[2::5, 0] = right
verts[2::5, 1] = top
verts[3::5, 0] = right
verts[3::5, 1] = bottom
剩下的就是创建路径,将其附加到 PathPatch ,并将其添加到我们的 Axes:
barpath = path.Path(verts, codes)
patch = patches.PathPatch(barpath, facecolor='green',
  edgecolor='yellow', alpha=0.5)
ax.add_patch(patch)
fig, ax = plt.subplots()
# Fixing random state for reproducibility
np.random.seed(19680801)

# histogram our data with numpy
data = np.random.randn(1000)
n, bins = np.histogram(data, 100)

# get the corners of the rectangles for the histogram
left = np.array(bins[:-1])
right = np.array(bins[1:])
bottom = np.zeros(len(left))
top = bottom + n
nrects = len(left)

nverts = nrects*(1+3+1)
verts = np.zeros((nverts, 2))
codes = np.full(nverts, Path.LINETO, dtype=int)
codes[0::5] = Path.MOVETO
codes[4::5] = Path.CLOSEPOLY
verts[0::5, 0] = left
verts[0::5, 1] = bottom
verts[1::5, 0] = left
verts[1::5, 1] = top
verts[2::5, 0] = right
verts[2::5, 1] = top
verts[3::5, 0] = right
verts[3::5, 1] = bottom

barpath = Path(verts, codes)
patch = patches.PathPatch(barpath, facecolor='green',
                          edgecolor='yellow', alpha=0.5)
ax.add_patch(patch)

ax.set_xlim(left[0], right[-1])
ax.set_ylim(bottom.min(), top.max())

plt.show()