艺术家介绍#
几乎所有您在 Matplotlib 图上交互的对象都称为"艺术家"(Artist)(并且是 Artist 类的子类). Figure 和 Axes 都是艺术家,通常包含 Axis 艺术家和包含数据或注释信息的艺术家.
创建艺术家#
通常我们不直接实例化艺术家,而是使用 Axes 上的绘图方法.下面给出了一些绘图方法以及它们创建的艺术家对象的例子:
Axes 辅助方法 |
艺术家 |
|---|---|
|
|
|
|
|
|
|
|
|
|
|
|
|
|
|
|
|
|
|
|
例如,我们可以保存从 axes.Axes.plot 返回的 Line2D 艺术家:
In [209]: import matplotlib.pyplot as plt
In [210]: import matplotlib.artist as martist
In [211]: import numpy as np

In [212]: fig, ax = plt.subplots()
In [213]: x, y = np.random.rand(2, 100)
In [214]: lines = ax.plot(x, y, '-', label='example')
In [215]: print(lines)
[<matplotlib.lines.Line2D at 0xd378b0c>]
请注意, plot 返回一个线的_列表_,因为您可以传入多个 x, y 对进行绘图.该行已添加到 Axes,我们可以通过 get_lines() 检索艺术家:
In [216]: print(ax.get_lines())
<a list of 1 Line2D objects>
In [217]: print(ax.get_lines()[0])
Line2D(example)
更改艺术家属性#
获取 lines 对象使我们可以访问 Line2D 对象的所有属性.因此,如果我们想事后更改线宽,我们可以使用 Artist.set 来进行更改.
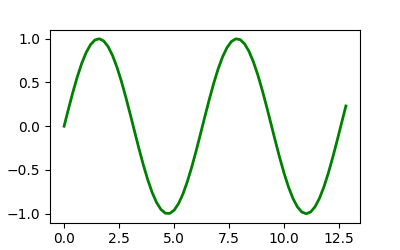
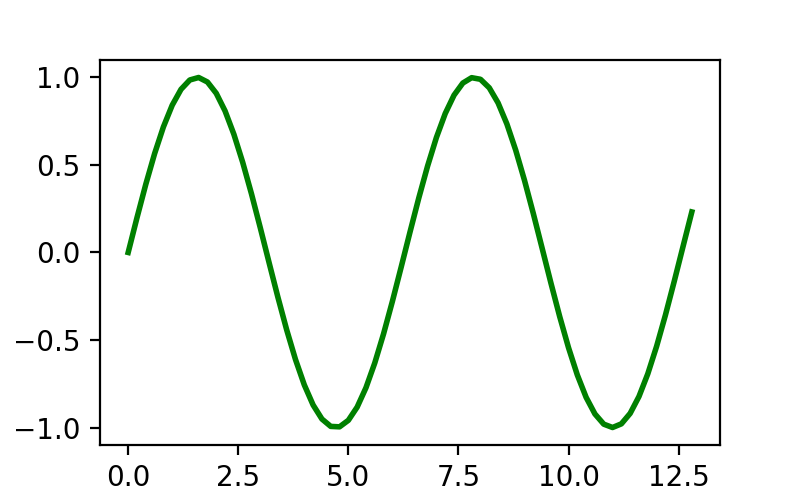
fig, ax = plt.subplots(figsize=(4, 2.5))
x = np.arange(0, 13, 0.2)
y = np.sin(x)
lines = ax.plot(x, y, '-', label='example', linewidth=0.2, color='blue')
lines[0].set(color='green', linewidth=2)
(Source code, png)
我们可以使用 matplotlib.artist.getp 查询完整的可设置属性列表:
In [218]: martist.getp(lines[0])
agg_filter = None
alpha = None
animated = False
antialiased or aa = True
bbox = Bbox(x0=0.004013842290585101, y0=0.013914221641967...
children = []
clip_box = TransformedBbox(     Bbox(x0=0.0, y0=0.0, x1=1.0, ...
clip_on = True
clip_path = None
color or c = blue
dash_capstyle = butt
dash_joinstyle = round
data = (array([0.91377845, 0.58456834, 0.36492019, 0.0379...
drawstyle or ds = default
figure = Figure(550x450)
fillstyle = full
gapcolor = None
gid = None
in_layout = True
label = example
linestyle or ls = -
linewidth or lw = 2.0
marker = None
markeredgecolor or mec = blue
markeredgewidth or mew = 1.0
markerfacecolor or mfc = blue
markerfacecoloralt or mfcalt = none
markersize or ms = 6.0
markevery = None
mouseover = False
path = Path(array([[0.91377845, 0.51224793],        [0.58...
path_effects = []
picker = None
pickradius = 5
rasterized = False
sketch_params = None
snap = None
solid_capstyle = projecting
solid_joinstyle = round
tightbbox = Bbox(x0=70.4609002763619, y0=54.321277798941786, x...
transform = CompositeGenericTransform(     TransformWrapper(  ...
transformed_clip_path_and_affine = (None, None)
url = None
visible = True
window_extent = Bbox(x0=70.4609002763619, y0=54.321277798941786, x...
xdata = [0.91377845 0.58456834 0.36492019 0.03796664 0.884...
xydata = [[0.91377845 0.51224793]  [0.58456834 0.9820474 ] ...
ydata = [0.51224793 0.9820474  0.24469912 0.61647032 0.483...
zorder = 2
请注意,大多数 Artist 也有一个不同的设置器列表;例如 Line2D.set_color 或 Line2D.set_linewidth .
更改 Artist 数据#
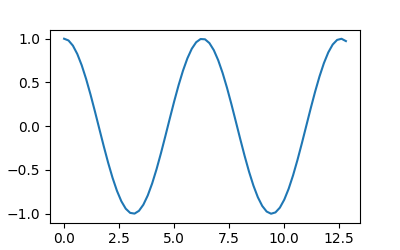
除了颜色和线宽等样式属性之外,Line2D 对象还具有数据属性.您可以使用 Line2D.set_data 在创建线条后设置数据.这通常用于动画,其中显示同一条线随时间演变(请参阅 使用 Matplotlib 的动画 )
fig, ax = plt.subplots(figsize=(4, 2.5))
x = np.arange(0, 13, 0.2)
y = np.sin(x)
lines = ax.plot(x, y, '-', label='example')
lines[0].set_data([x, np.cos(x)])
(Source code, png)

手动添加 Artists#
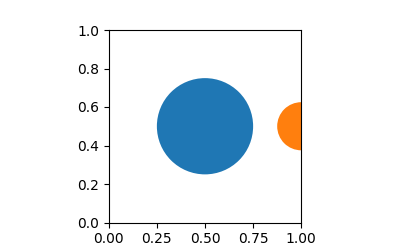
并非所有 Artist 都有辅助方法,或者您可能出于某种原因想要使用低级方法.例如, patches.Circle Artist 没有辅助方法,但我们仍然可以使用 axes.Axes.add_artist 方法创建并添加到 Axes:
import matplotlib.patches as mpatches

fig, ax = plt.subplots(figsize=(4, 2.5))
circle = mpatches.Circle((0.5, 0.5), 0.25, ec="none")
ax.add_artist(circle)
clipped_circle = mpatches.Circle((1, 0.5), 0.125, ec="none", facecolor='C1')
ax.add_artist(clipped_circle)
ax.set_aspect(1)
(Source code, png)

Circle 接受 Circle 的中心和半径作为其构造函数的参数;可选参数作为关键字参数传递.
请注意,当我们像这样手动添加 Artist 时,它不一定会像大多数辅助方法那样调整轴限制,因此 Artist 可能会被裁剪,就像上面的 clipped_circle 补丁一样.
有关其他补丁,请参见 Matplotlib artists 参考 .
移除 Artists#
有时我们想从图中删除一个 Artist,而无需从头开始重新指定整个图形.大多数 Artist 都有一个可用的 remove 方法,该方法将从其 Axes 列表中删除该 Artist.例如, lines[0].remove() 将删除上面示例中创建的 Line2D artist.