备注
Go to the end 下载完整的示例代码.
艺术家教程#
使用 Artist 对象在画布上渲染.
Matplotlib API 有三个层级.
matplotlib.backend_bases.FigureCanvas是绘制图形的区域matplotlib.backend_bases.Renderer是知道如何在matplotlib.backend_bases.FigureCanvas上绘制的对象而
matplotlib.artist.Artist是知道如何使用渲染器在画布上绘制的对象.
matplotlib.backend_bases.FigureCanvas 和 matplotlib.backend_bases.Renderer 处理与用户界面工具包(如 wxPython )或绘图语言(如 PostScript®)通信的所有细节,而 Artist 处理所有高级构造,如表示和布局图形,文本和线条.典型的用户将花费 95% 的时间与 Artists 互动.
Artists 有两种类型:primitives(基本体)和 containers(容器).基本体表示我们想要绘制到画布上的标准图形对象 Line2D , Rectangle , Text , AxesImage 等,而容器是放置它们的地方( Axis , Axes 和 Figure ).标准用法是创建一个 Figure 实例,使用 Figure 创建一个或多个 Axes 实例,并使用 Axes 实例辅助方法创建基本体.在下面的例子中,我们使用 matplotlib.pyplot.figure() 创建一个 Figure 实例,这是一种方便的方法,用于实例化 Figure 实例并将它们与您的用户界面或绘图工具包 FigureCanvas 连接.正如我们将在下面讨论的那样,这不是必需的 -- 您可以直接使用 PostScript,PDF Gtk+ 或 wxPython FigureCanvas 实例,直接实例化您的 Figures 并自己连接它们 -- 但由于我们在这里专注于 Artist API,我们将让 pyplot 处理其中的一些细节:
import matplotlib.pyplot as plt
fig = plt.figure()
ax = fig.add_subplot(2, 1, 1) # two rows, one column, first plot
Axes 可能是 Matplotlib API 中最重要的类,也是您将花费最多时间的类.这是因为 Axes 是大多数对象进入的绘图区域,并且 Axes 有许多特殊的辅助方法( plot() , text() , hist() , imshow() )来创建最常见的图形基本体(分别为 Line2D , Text , Rectangle , AxesImage ).这些辅助方法将获取您的数据(例如, numpy 数组和字符串)并根据需要创建基本 Artist 实例(例如, Line2D ),将它们添加到相关容器,并在请求时绘制它们.如果您想在任意位置创建一个 Axes ,只需使用 add_axes() 方法,该方法采用 0-1 相对图形坐标中的 [left, bottom, width, height] 值列表:
fig2 = plt.figure()
ax2 = fig2.add_axes([0.15, 0.1, 0.7, 0.3])
继续我们的例子:
import numpy as np
t = np.arange(0.0, 1.0, 0.01)
s = np.sin(2*np.pi*t)
line, = ax.plot(t, s, color='blue', lw=2)
在这个例子中, ax 是由上面的 fig.add_subplot 调用创建的 Axes 实例,当您调用 ax.plot 时,它会创建一个 Line2D 实例并将其添加到 Axes .在下面的交互式 IPython 会话中,您可以看到 Axes.lines 列表的长度为 1,并且包含与 line, = ax.plot... 调用返回的行相同的行:
In [101]: ax.lines[0]
Out[101]: <matplotlib.lines.Line2D at 0x19a95710>

In [102]: line
Out[102]: <matplotlib.lines.Line2D at 0x19a95710>
如果您后续调用 ax.plot (并且保持状态为"on",这是默认设置),则会将其他行添加到列表中.您可以通过调用其 remove 方法稍后删除一行:
line = ax.lines[0]
line.remove()
Axes 还有辅助方法来配置和装饰 x 轴和 y 轴刻度,刻度标签和轴标签:
xtext = ax.set_xlabel('my xdata')  # returns a Text instance
ytext = ax.set_ylabel('my ydata')
当你调用 ax.set_xlabel 时,它会将信息传递给 Text 的 XAxis 实例.每个 Axes 实例都包含一个 XAxis 和一个 YAxis 实例,它们处理刻度,刻度标签和轴标签的布局和绘制.
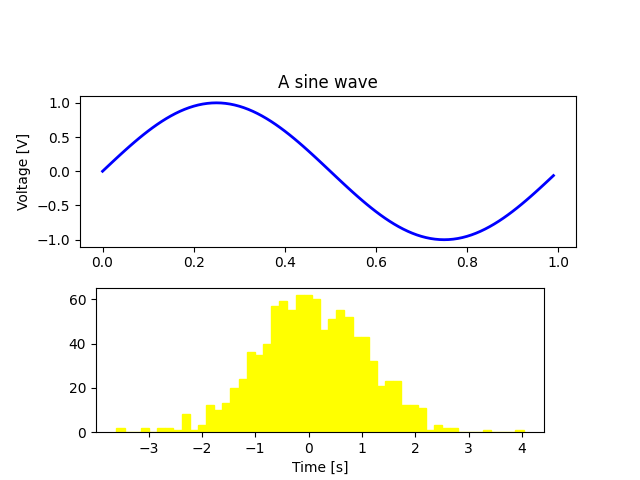
尝试创建下面的图形.
import matplotlib.pyplot as plt
import numpy as np

fig = plt.figure()
fig.subplots_adjust(top=0.8)
ax1 = fig.add_subplot(211)
ax1.set_ylabel('Voltage [V]')
ax1.set_title('A sine wave')

t = np.arange(0.0, 1.0, 0.01)
s = np.sin(2*np.pi*t)
line, = ax1.plot(t, s, color='blue', lw=2)

# Fixing random state for reproducibility
np.random.seed(19680801)

ax2 = fig.add_axes([0.15, 0.1, 0.7, 0.3])
n, bins, patches = ax2.hist(np.random.randn(1000), 50,
                            facecolor='yellow', edgecolor='yellow')
ax2.set_xlabel('Time [s]')

plt.show()
自定义你的对象#
图形中的每个元素都由 Matplotlib Artist 表示,并且每个元素都有一个广泛的属性列表来配置其外观.图形本身包含一个 Rectangle ,其大小与图形完全相同,你可以使用它来设置图形的背景颜色和透明度.同样,每个 Axes 边界框(典型 Matplotlib 图中的标准白色框,带有黑色边缘)都有一个 Rectangle 实例,该实例确定 Axes 的颜色,透明度和其他属性.这些实例存储为成员变量 Figure.patch 和 Axes.patch ("Patch"是继承自 MATLAB 的名称,是图形上的 2D"patch"着色,例如,矩形,圆形和多边形).每个 Matplotlib Artist 都有以下属性
属性 |
描述 |
|---|---|
alpha |
透明度 - 介于 0-1 之间的标量 |
animated |
一个用于方便动画绘制的布尔值 |
axes |
Artist 所在的 Axes,可能为 None |
clip_box |
裁剪 Artist 的边界框 |
clip_on |
是否启用裁剪 |
clip_path |
Artist 裁剪到的路径 |
contains |
一个用于测试 Artist 是否包含拾取点的拾取函数 |
figure |
Artist 所在的图形实例,可能为 None |
label |
文本标签(例如,用于自动标记) |
picker |
一个控制对象拾取的 Python 对象 |
transform |
转换 |
visible |
一个布尔值,指示是否应绘制 Artist |
zorder |
一个确定绘制顺序的数字 |
rasterized |
布尔值;将矢量转换为栅格图形(用于压缩和 EPS 透明度) |
每个属性都使用传统方式的 setter 或 getter 进行访问(是的,我们知道这会激怒 Python 爱好者,我们计划支持通过属性或特征直接访问,但尚未完成).例如,要将当前 alpha 乘以一半:
a = o.get_alpha()
o.set_alpha(0.5*a)
如果想一次设置多个属性,还可以使用带有关键字参数的 set 方法.例如:
o.set(alpha=0.5, zorder=2)
如果你在 python shell 中进行交互式工作,一个检查 Artist 属性的便捷方法是使用 matplotlib.artist.getp() 函数(在 pyplot 中简称为 getp() ),该函数列出属性及其值.这也适用于从 Artist 派生的类,例如 Figure 和 Rectangle .以下是上面提到的 Figure 矩形属性:
In [149]: matplotlib.artist.getp(fig.patch)
  agg_filter = None
  alpha = None
  animated = False
  antialiased or aa = False
  bbox = Bbox(x0=0.0, y0=0.0, x1=1.0, y1=1.0)
  capstyle = butt
  children = []
  clip_box = None
  clip_on = True
  clip_path = None
  contains = None
  data_transform = BboxTransformTo(     TransformedBbox(         Bbox...
  edgecolor or ec = (1.0, 1.0, 1.0, 1.0)
  extents = Bbox(x0=0.0, y0=0.0, x1=640.0, y1=480.0)
  facecolor or fc = (1.0, 1.0, 1.0, 1.0)
  figure = Figure(640x480)
  fill = True
  gid = None
  hatch = None
  height = 1
  in_layout = False
  joinstyle = miter
  label =
  linestyle or ls = solid
  linewidth or lw = 0.0
  patch_transform = CompositeGenericTransform(     BboxTransformTo(   ...
  path = Path(array([[0., 0.],        [1., 0.],        [1.,...
  path_effects = []
  picker = None
  rasterized = None
  sketch_params = None
  snap = None
  transform = CompositeGenericTransform(     CompositeGenericTra...
  transformed_clip_path_and_affine = (None, None)
  url = None
  verts = [[  0.   0.]  [640.   0.]  [640. 480.]  [  0. 480....
  visible = True
  width = 1
  window_extent = Bbox(x0=0.0, y0=0.0, x1=640.0, y1=480.0)
  x = 0
  xy = (0, 0)
  y = 0
  zorder = 1
所有类的文档字符串也包含 Artist 属性,因此你可以查阅交互式"帮助"或 artist-api 以获取给定对象的属性列表.
对象容器#
现在我们知道如何检查和设置要配置的给定对象的属性,我们需要知道如何访问该对象.正如引言中提到的,有两种类型的对象:primitives(基本体)和 containers(容器).primitives 通常是你想要配置的东西( Text 实例的字体, Line2D 的宽度),虽然 containers 也有一些属性--例如, Axes Artist 是一个容器,包含绘图中的许多 primitives,但它也有像 xscale 这样的属性来控制 xaxis 是 "linear" 还是 "log".在本节中,我们将回顾各种 container 对象存储你想要访问的 Artists 的位置.
Figure 容器#
顶层 container Artist 是 matplotlib.figure.Figure ,它包含图形中的所有内容.图形的背景是一个 Rectangle ,存储在 Figure.patch 中.当你向图形添加 subplots ( add_subplot() ) 和 Axes ( add_axes() ) 时,它们将被追加到 Figure.axes .这些也由创建它们的方法返回:
In [156]: fig = plt.figure()

In [157]: ax1 = fig.add_subplot(211)

In [158]: ax2 = fig.add_axes([0.1, 0.1, 0.7, 0.3])

In [159]: ax1
Out[159]: <Axes:>

In [160]: print(fig.axes)
[<Axes:>, <matplotlib.axes._axes.Axes object at 0x7f0768702be0>]
由于 figure 保持了"当前坐标轴"的概念(参见 Figure.gca 和 Figure.sca )以支持 pylab/pyplot 状态机,因此你不应该直接从坐标轴列表中插入或删除坐标轴,而应该使用 add_subplot() 和 add_axes() 方法来插入,以及 Axes.remove 方法来删除.但是,你可以自由地迭代坐标轴列表或对其进行索引,以访问你想要自定义的 Axes 实例.这是一个打开所有坐标轴网格的例子:
for ax in fig.axes:
    ax.grid(True)
figure 也有自己的 images , lines , patches 和 text 属性,你可以使用它们直接添加图元.这样做时, Figure 的默认坐标系将只使用像素(这通常不是你想要的).如果你改为使用 Figure 级别的方法添加 Artist(例如,使用 Figure.text 添加文本),那么默认坐标系将是"figure 坐标",其中 (0, 0) 是 figure 的左下角,(1, 1) 是 figure 的右上角.
与所有 Artist 一样,你可以通过设置 transform 属性来控制此坐标系.你可以通过将 Artist 变换设置为 fig.transFigure 来显式使用"figure 坐标":
import matplotlib.lines as lines

fig = plt.figure()

l1 = lines.Line2D([0, 1], [0, 1], transform=fig.transFigure, figure=fig)
l2 = lines.Line2D([0, 1], [1, 0], transform=fig.transFigure, figure=fig)
fig.lines.extend([l1, l2])

plt.show()

以下是 Figure 包含的 Artist 的摘要
Figure属性 |
描述 |
|---|---|
axes |
|
patch |
|
images |
|
legends |
Figure |
lines |
Figure |
patches |
Figure |
texts |
Figure |
坐标轴容器#
matplotlib.axes.Axes 是 Matplotlib 世界的中心 -- 它包含了 figure 中使用的大部分 Artists ,以及许多用于创建这些 Artists 并将其添加到自身的辅助方法,以及用于访问和自定义它包含的 Artists 的辅助方法.与 Figure 类似,它包含一个 Patch matplotlib.axes.Axes.patch ,对于笛卡尔坐标,它是一个 Rectangle ,对于极坐标,它是一个 Circle ;此 patch 确定了绘图区域的形状,背景和边框:
ax = fig.add_subplot()
rect = ax.patch  # a Rectangle instance
rect.set_facecolor('green')
当你调用一个绘图方法,例如典型的 plot 并传入数组或值列表时,该方法将创建一个 matplotlib.lines.Line2D 实例,使用作为关键字参数传递的所有 Line2D 属性更新该行,将该行添加到 Axes ,并将其返回给你:
In [213]: x, y = np.random.rand(2, 100)

In [214]: line, = ax.plot(x, y, '-', color='blue', linewidth=2)
plot 返回一个行列表,因为你可以传入多个 x, y 对进行绘制,并且我们将长度为 1 的列表的第一个元素解包到 line 变量中.该行已添加到 Axes.lines 列表中:
In [229]: print(ax.lines)
[<matplotlib.lines.Line2D at 0xd378b0c>]
类似地,创建 patches 的方法,如 bar() 创建一个矩形列表,会将 patches 添加到 Axes.patches 列表中:
In [233]: n, bins, rectangles = ax.hist(np.random.randn(1000), 50)

In [234]: rectangles
Out[234]: <BarContainer object of 50 artists>

In [235]: print(len(ax.patches))
Out[235]: 50
你不应该直接将对象添加到 Axes.lines 或 Axes.patches 列表,因为 Axes 在创建和添加对象时需要做一些事情:
它设置
Artist的figure和axes属性;它设置默认的
Axes转换(除非已设置);它检查
Artist中包含的数据,以更新控制自动缩放的数据结构,以便可以调整视图限制以包含绘制的数据.
尽管如此,你仍然可以自己创建对象,并使用诸如 add_line 和 add_patch 之类的辅助方法将它们直接添加到 Axes .这是一个带注释的交互式会话,说明了正在发生的事情:
In [262]: fig, ax = plt.subplots()

# create a rectangle instance
In [263]: rect = matplotlib.patches.Rectangle((1, 1), width=5, height=12)

# by default the Axes instance is None
In [264]: print(rect.axes)
None

# and the transformation instance is set to the "identity transform"
In [265]: print(rect.get_data_transform())
IdentityTransform()

# now we add the Rectangle to the Axes
In [266]: ax.add_patch(rect)

# and notice that the ax.add_patch method has set the Axes
# instance
In [267]: print(rect.axes)
Axes(0.125,0.1;0.775x0.8)

# and the transformation has been set too
In [268]: print(rect.get_data_transform())
CompositeGenericTransform(
    TransformWrapper(
        BlendedAffine2D(
            IdentityTransform(),
            IdentityTransform())),
    CompositeGenericTransform(
        BboxTransformFrom(
            TransformedBbox(
                Bbox(x0=0.0, y0=0.0, x1=1.0, y1=1.0),
                TransformWrapper(
                    BlendedAffine2D(
                        IdentityTransform(),
                        IdentityTransform())))),
        BboxTransformTo(
            TransformedBbox(
                Bbox(x0=0.125, y0=0.10999999999999999, x1=0.9, y1=0.88),
                BboxTransformTo(
                    TransformedBbox(
                        Bbox(x0=0.0, y0=0.0, x1=6.4, y1=4.8),
                        Affine2D(
                            [[100.   0.   0.]
                             [  0. 100.   0.]
                             [  0.   0.   1.]])))))))

# the default Axes transformation is ax.transData
In [269]: print(ax.transData)
CompositeGenericTransform(
    TransformWrapper(
        BlendedAffine2D(
            IdentityTransform(),
            IdentityTransform())),
    CompositeGenericTransform(
        BboxTransformFrom(
            TransformedBbox(
                Bbox(x0=0.0, y0=0.0, x1=1.0, y1=1.0),
                TransformWrapper(
                    BlendedAffine2D(
                        IdentityTransform(),
                        IdentityTransform())))),
        BboxTransformTo(
            TransformedBbox(
                Bbox(x0=0.125, y0=0.10999999999999999, x1=0.9, y1=0.88),
                BboxTransformTo(
                    TransformedBbox(
                        Bbox(x0=0.0, y0=0.0, x1=6.4, y1=4.8),
                        Affine2D(
                            [[100.   0.   0.]
                             [  0. 100.   0.]
                             [  0.   0.   1.]])))))))

# notice that the xlimits of the Axes have not been changed
In [270]: print(ax.get_xlim())
(0.0, 1.0)

# but the data limits have been updated to encompass the rectangle
In [271]: print(ax.dataLim.bounds)
(1.0, 1.0, 5.0, 12.0)

# we can manually invoke the auto-scaling machinery
In [272]: ax.autoscale_view()

# and now the xlim are updated to encompass the rectangle, plus margins
In [273]: print(ax.get_xlim())
(0.75, 6.25)

# we have to manually force a figure draw
In [274]: fig.canvas.draw()
有许多 Axes 辅助方法可以创建原始 Artists 并将它们添加到各自的容器中.下表总结了它们的一小部分示例,它们创建的 Artist 类型以及它们存储的位置
坐标轴辅助方法 |
艺术家 (Artist) |
容器 (Container) |
|---|---|---|
|
|
ax.texts |
|
|
ax.patches |
|
|
ax.lines 和 ax.patches |
|
|
ax.patches |
|
|
ax.patches |
|
|
ax.images |
|
|
ax.get_legend() |
|
|
ax.lines |
|
|
ax.collections |
|
|
ax.texts |
除了所有这些 Artists 之外, Axes 还包含两个重要的 Artist 容器 XAxis 和 YAxis ,它们处理刻度和标签的绘制.这些存储为实例变量 matplotlib.axes.Axes.xaxis 和 matplotlib.axes.Axes.yaxis . XAxis 和 YAxis 容器将在下面详细介绍,但请注意, Axes 包含许多辅助方法,这些方法将调用转发到 Axis 实例,因此通常不需要直接使用它们,除非你想这样做.例如,可以使用 Axes 辅助方法设置 XAxis 刻度标签的字体颜色:
ax.tick_params(axis='x', labelcolor='orange')
以下是 Axes 包含的 Artists 的摘要
坐标轴属性 |
描述 |
|---|---|
artists |
|
patch |
用于坐标轴背景的 |
collections |
|
images |
|
lines |
|
patches |
|
texts |
|
xaxis |
|
yaxis |
|
可以通过 get_legend 访问图例,
轴容器#
matplotlib.axis.Axis 实例处理刻度线,网格线,刻度标签和轴标签的绘制.可以分别配置 y 轴的左侧和右侧刻度,以及 x 轴的上方和下方刻度. Axis 还存储用于自动缩放,平移和缩放的数据和视图间隔,以及控制刻度放置位置以及如何将刻度表示为字符串的 Locator 和 Formatter 实例.
每个 Axis 对象都包含一个 label 属性(这是 pyplot 在调用 xlabel 和 ylabel 时修改的内容),以及一个主刻度和次刻度列表.刻度是 axis.XTick 和 axis.YTick 实例,其中包含呈现刻度和刻度标签的实际线条和文本图元.由于刻度是根据需要动态创建的(例如,在平移和缩放时),因此应通过其访问器方法 axis.Axis.get_major_ticks 和 axis.Axis.get_minor_ticks 访问主刻度和次刻度列表.虽然刻度包含所有图元,并且将在下面介绍,但 Axis 实例具有访问器方法,可返回刻度线,刻度标签,刻度位置等:
fig, ax = plt.subplots()
axis = ax.xaxis
axis.get_ticklocs()
array([0. , 0.2, 0.4, 0.6, 0.8, 1. ])
axis.get_ticklabels()
[Text(0.0, 0, '0.0'), Text(0.2, 0, '0.2'), Text(0.4, 0, '0.4'), Text(0.6000000000000001, 0, '0.6'), Text(0.8, 0, '0.8'), Text(1.0, 0, '1.0')]
请注意,刻度线的数量是标签的两倍,因为默认情况下,顶部和底部都有刻度线,但只有 xaxis 下方有刻度标签;但是,这是可以自定义的.
axis.get_ticklines()
<a list of 12 Line2D ticklines objects>
通过以上方法,默认情况下只能获得主刻度列表,但也可以请求次刻度:
axis.get_ticklabels(minor=True)
axis.get_ticklines(minor=True)
<a list of 0 Line2D ticklines objects>
以下是 Axis 的一些有用访问器方法的摘要(这些方法具有相应的设置器,例如 set_major_formatter() .)
轴访问器方法 |
描述 |
|---|---|
|
坐标轴的刻度,例如,"log"或"linear" |
|
坐标轴视图限制的间隔实例 |
|
坐标轴数据限制的间隔实例 |
|
坐标轴的网格线列表 |
|
轴标签 - |
|
轴偏移文本 - |
|
|
|
|
|
刻度线位置列表 - 关键字 minor=True|False |
|
主刻度的 |
|
主刻度的 |
|
次刻度的 |
|
次刻度的 |
|
主刻度的 |
|
次刻度的 |
|
打开或关闭主刻度或次刻度的网格 |
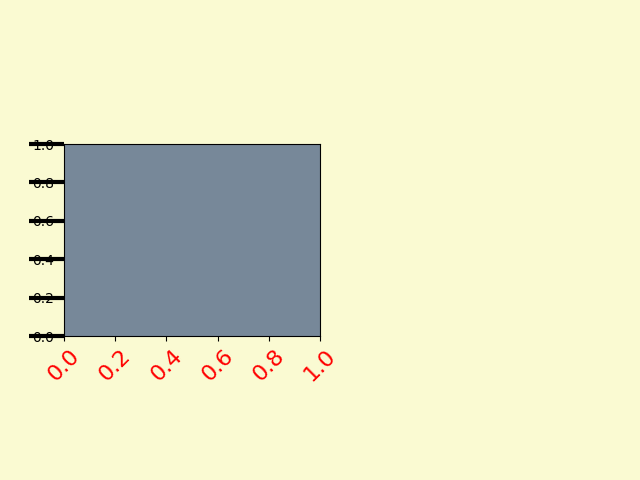
这是一个例子,虽然不推荐它的美观性,但它自定义了 Axes 和 Tick 属性.
# plt.figure creates a matplotlib.figure.Figure instance
fig = plt.figure()
rect = fig.patch  # a rectangle instance
rect.set_facecolor('lightgoldenrodyellow')

ax1 = fig.add_axes([0.1, 0.3, 0.4, 0.4])
rect = ax1.patch
rect.set_facecolor('lightslategray')


for label in ax1.xaxis.get_ticklabels():
    # label is a Text instance
    label.set_color('red')
    label.set_rotation(45)
    label.set_fontsize(16)

for line in ax1.yaxis.get_ticklines():
    # line is a Line2D instance
    line.set_color('green')
    line.set_markersize(25)
    line.set_markeredgewidth(3)

plt.show()
刻度容器#
matplotlib.axis.Tick 是我们从 Figure 到 Axes 到 Axis 再到 Tick 的最终容器对象. Tick 包含刻度和网格线实例,以及上下刻度的标签实例. 这些都可以直接作为 Tick 的属性访问.
刻度属性 |
描述 |
|---|---|
tick1line |
一个 |
tick2line |
一个 |
gridline |
一个 |
label1 |
一个 |
label2 |
一个 |
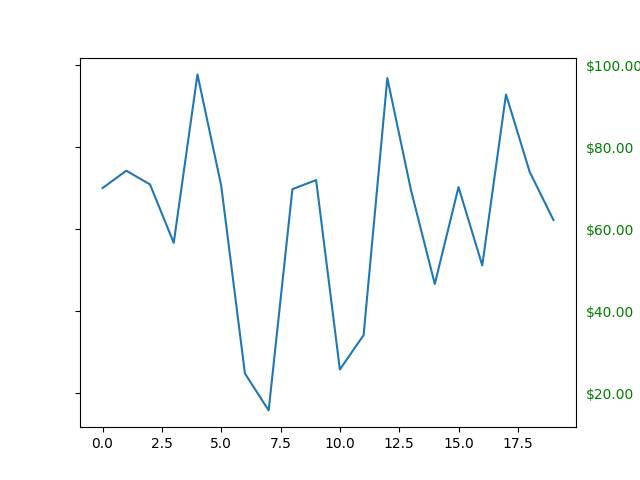
这是一个例子,它为右侧刻度设置了带有美元符号的格式化器,并在 y 轴的右侧将它们着色为绿色.
import matplotlib.pyplot as plt
import numpy as np

# Fixing random state for reproducibility
np.random.seed(19680801)

fig, ax = plt.subplots()
ax.plot(100*np.random.rand(20))

# Use automatic StrMethodFormatter
ax.yaxis.set_major_formatter('${x:1.2f}')

ax.yaxis.set_tick_params(which='major', labelcolor='green',
                         labelleft=False, labelright=True)

plt.show()