Matplotlib 3.7.0 (2023年2月13日) 的新特性#
有关自上次修订以来的所有问题和 pull request 的列表,请参阅 3.10.0 的 GitHub 统计信息 (2024 年 12 月 13 日) .
绘图和注释改进#
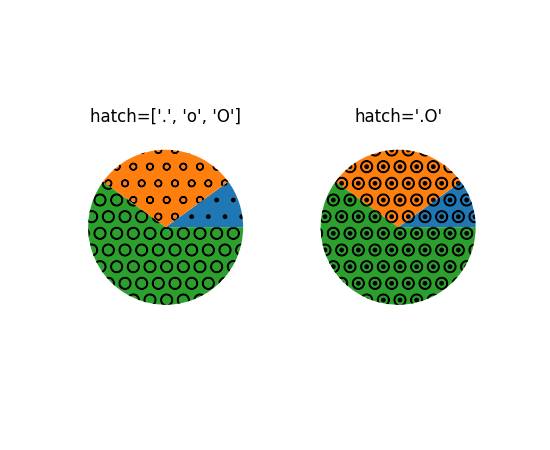
饼图的 hatch 参数#
pie 现在接受一个 hatch 关键字,该关键字接受一个填充图案或填充图案列表作为输入:
fig, (ax1, ax2) = plt.subplots(ncols=2)
x = [10, 30, 60]

ax1.pie(x, hatch=['.', 'o', 'O'])
ax2.pie(x, hatch='.O')

ax1.set_title("hatch=['.', 'o', 'O']")
ax2.set_title("hatch='.O'")
(Source code, png)

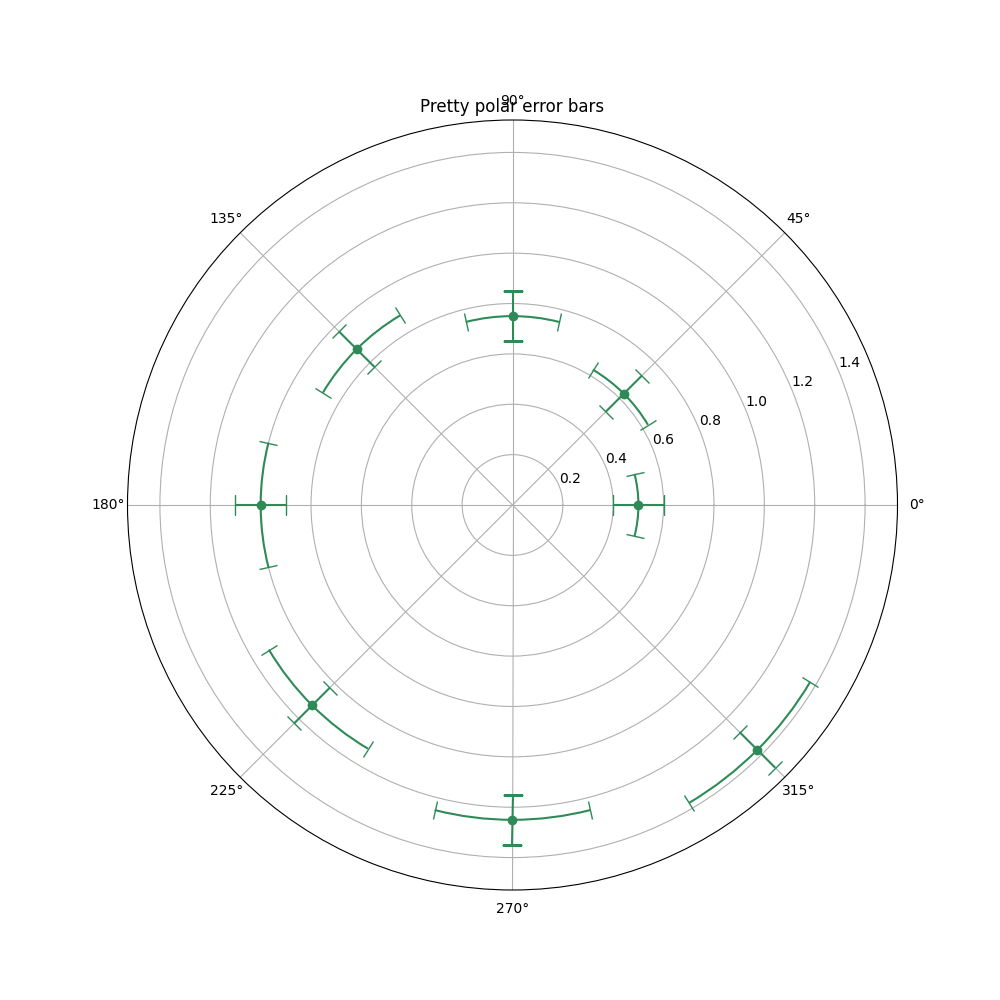
在极坐标中绘制极坐标图误差#
当在极坐标图上绘制误差线时,帽和误差线现在根据极坐标绘制.
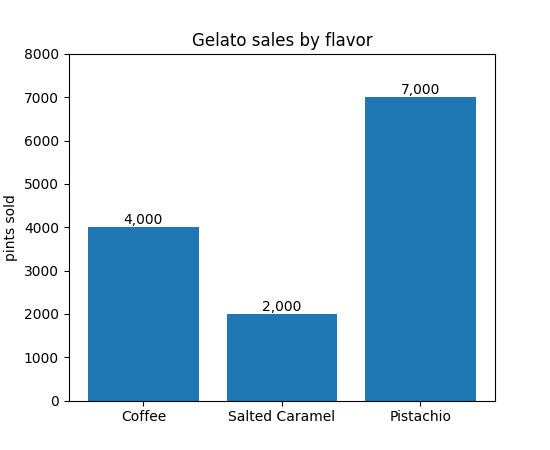
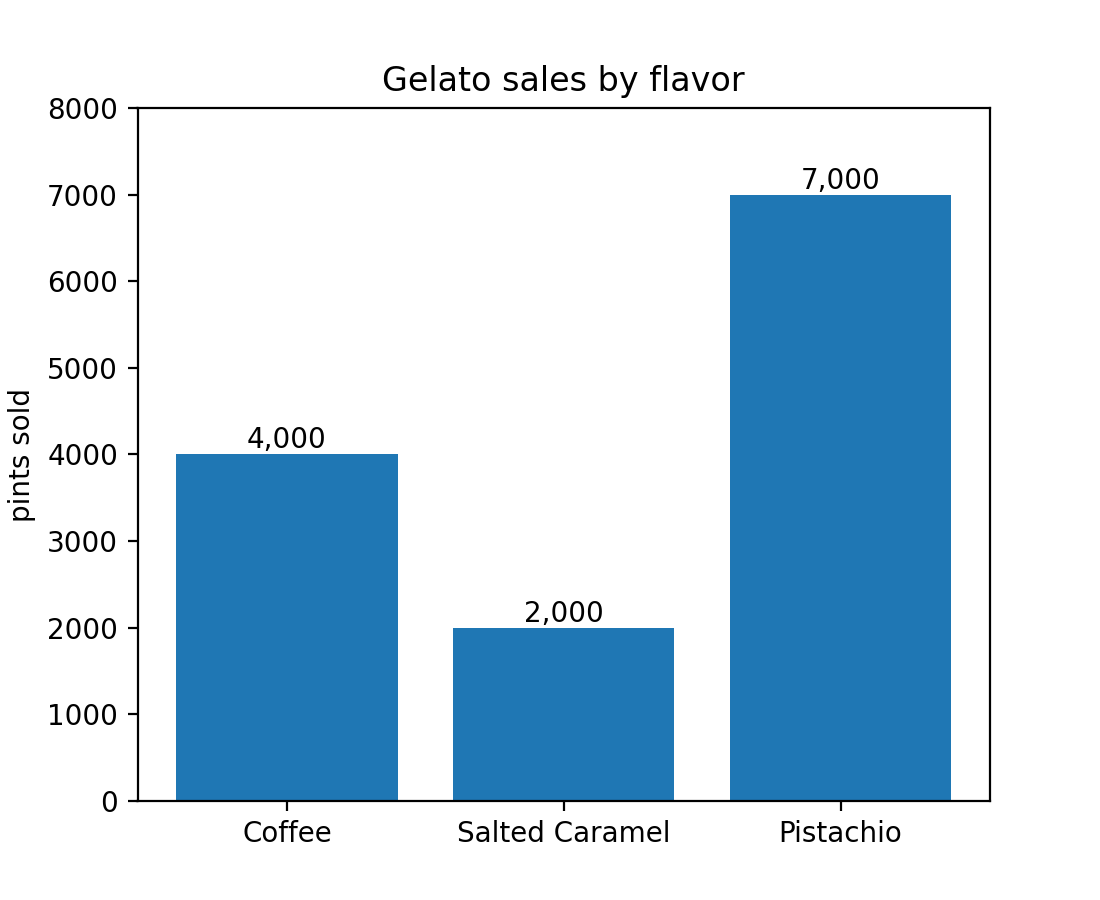
bar_label 中的其他格式字符串选项#
bar_label 的 fmt 参数现在接受 {}-style 格式字符串:
import matplotlib.pyplot as plt

fruit_names = ['Coffee', 'Salted Caramel', 'Pistachio']
fruit_counts = [4000, 2000, 7000]

fig, ax = plt.subplots()
bar_container = ax.bar(fruit_names, fruit_counts)
ax.set(ylabel='pints sold', title='Gelato sales by flavor', ylim=(0, 8000))
ax.bar_label(bar_container, fmt='{:,.0f}')
(Source code, png)
它也接受可调用对象:
animal_names = ['Lion', 'Gazelle', 'Cheetah']
mph_speed = [50, 60, 75]

fig, ax = plt.subplots()
bar_container = ax.bar(animal_names, mph_speed)
ax.set(ylabel='speed in MPH', title='Running speeds', ylim=(0, 80))
ax.bar_label(
    bar_container, fmt=lambda x: '{:.1f} km/h'.format(x * 1.61)
)
(Source code, png)
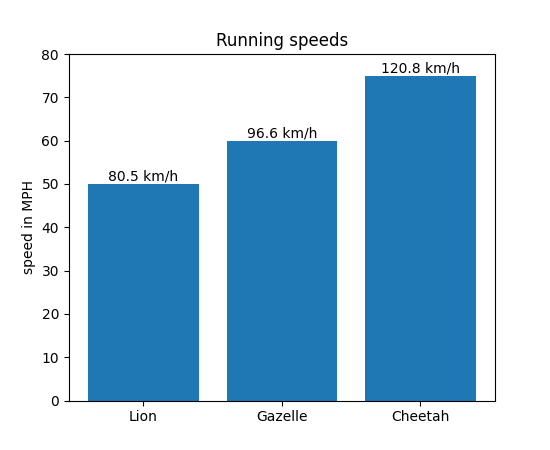

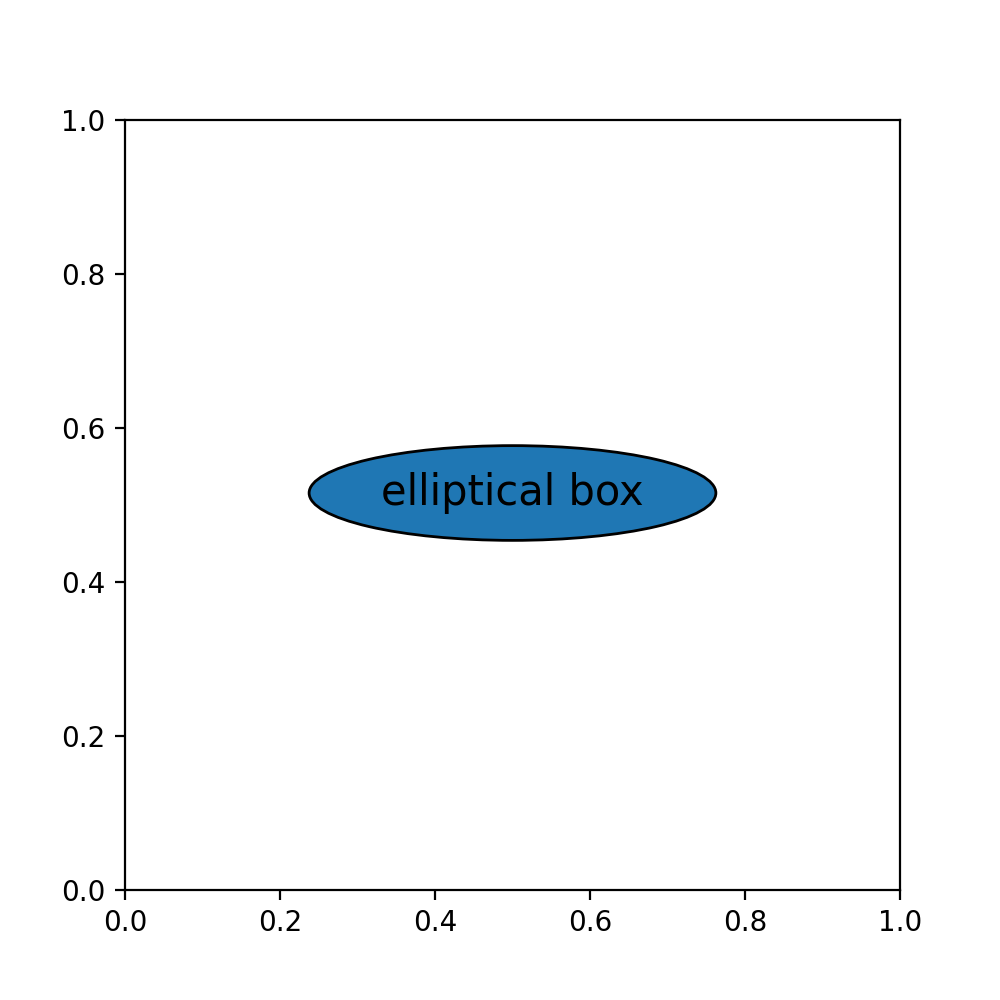
注释的 ellipse boxstyle 选项#
boxstyle 的 'ellipse' 选项现在可用于创建具有椭圆轮廓的注释.它可以用作较长文本的闭合曲线形状,而不是可能变得很大的 'circle' boxstyle.
import matplotlib.pyplot as plt
fig, ax = plt.subplots(figsize=(5, 5))
t = ax.text(0.5, 0.5, "elliptical box",
        ha="center", size=15,
        bbox=dict(boxstyle="ellipse,pad=0.3"))
(Source code, png)
imshow 的范围现在可以用单位表示#
imshow 和 set_extent 的 extent 参数现在可以用单位表示.
import matplotlib.pyplot as plt
import numpy as np

fig, ax = plt.subplots(layout='constrained')
date_first = np.datetime64('2020-01-01', 'D')
date_last = np.datetime64('2020-01-11', 'D')

arr = [[i+j for i in range(10)] for j in range(10)]

ax.imshow(arr, origin='lower', extent=[0, 10, date_first, date_last])

plt.show()
(Source code, png)
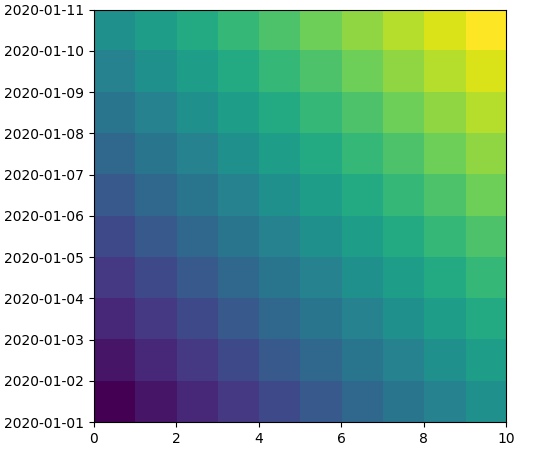
反转图例条目的顺序#
现在可以通过将 reverse=True 传递给 legend 来反转图例条目的顺序.
pcolormesh 接受 RGB(A) 颜色#
pcolormesh 方法现在可以处理用 RGB(A) 值指定的显式颜色. 要指定颜色,数组必须是 3D 的,形状为 (M, N, [3, 4]) .
import matplotlib.pyplot as plt
import numpy as np

colors = np.linspace(0, 1, 90).reshape((5, 6, 3))
plt.pcolormesh(colors)
plt.show()
(Source code, png)

查看刻度,刻度标签和网格线的当前外观设置#
新的 get_tick_params 方法可用于检索将应用于添加到绘图的任何其他刻度,刻度标签和网格线的外观设置:
>>> import matplotlib.pyplot as plt

>>> fig, ax = plt.subplots()
>>> ax.yaxis.set_tick_params(labelsize=30, labelcolor='red',
...                          direction='out', which='major')
>>> ax.yaxis.get_tick_params(which='major')
{'direction': 'out',
'left': True,
'right': False,
'labelleft': True,
'labelright': False,
'gridOn': False,
'labelsize': 30,
'labelcolor': 'red'}
>>> ax.yaxis.get_tick_params(which='minor')
{'left': True,
'right': False,
'labelleft': True,
'labelright': False,
'gridOn': False}
样式文件可以从第三方包导入#
第三方包现在可以分发全局可用的样式文件,如下所示.假设一个包可以像 import mypackage 一样导入,并且有一个 mypackage/__init__.py 模块.那么 mypackage/presentation.mplstyle 样式表可以像这样使用: plt.style.use("mypackage.presentation") .
该实现实际上并没有导入 mypackage ,这使得该过程对于可能的导入时副作用是安全的.也支持子包(例如 dotted.package.name ).
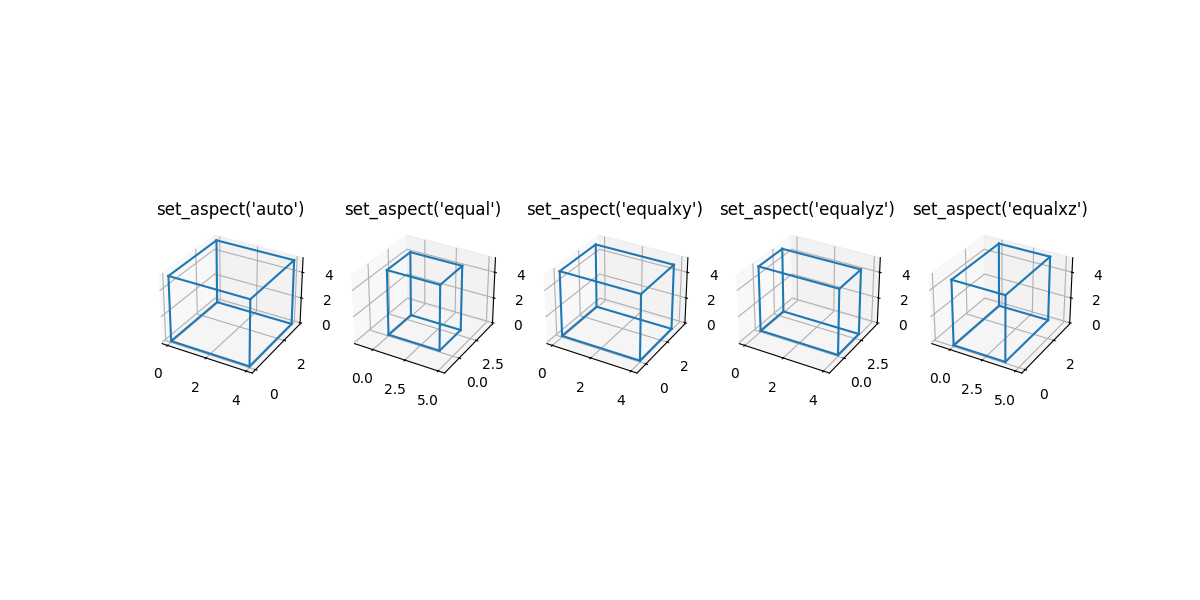
3D 绘图的改进#
用于在 3D 中设置相等纵横比的 adjustable 关键字参数#
在为 3D 图设置相等纵横比时,用户可以选择修改数据限制或边界框,使其与 2D 轴对齐.
import matplotlib.pyplot as plt
import numpy as np
from itertools import combinations, product

aspects = ('auto', 'equal', 'equalxy', 'equalyz', 'equalxz')
fig, axs = plt.subplots(1, len(aspects), subplot_kw={'projection': '3d'},
                        figsize=(12, 6))

# Draw rectangular cuboid with side lengths [4, 3, 5]
r = [0, 1]
scale = np.array([4, 3, 5])
pts = combinations(np.array(list(product(r, r, r))), 2)
for start, end in pts:
    if np.sum(np.abs(start - end)) == r[1] - r[0]:
        for ax in axs:
            ax.plot3D(*zip(start*scale, end*scale), color='C0')

# Set the aspect ratios
for i, ax in enumerate(axs):
    ax.set_aspect(aspects[i], adjustable='datalim')
    # Alternatively: ax.set_aspect(aspects[i], adjustable='box')
    # which will change the box aspect ratio instead of axis data limits.
    ax.set_title(f"set_aspect('{aspects[i]}')")

plt.show()
(Source code, png)
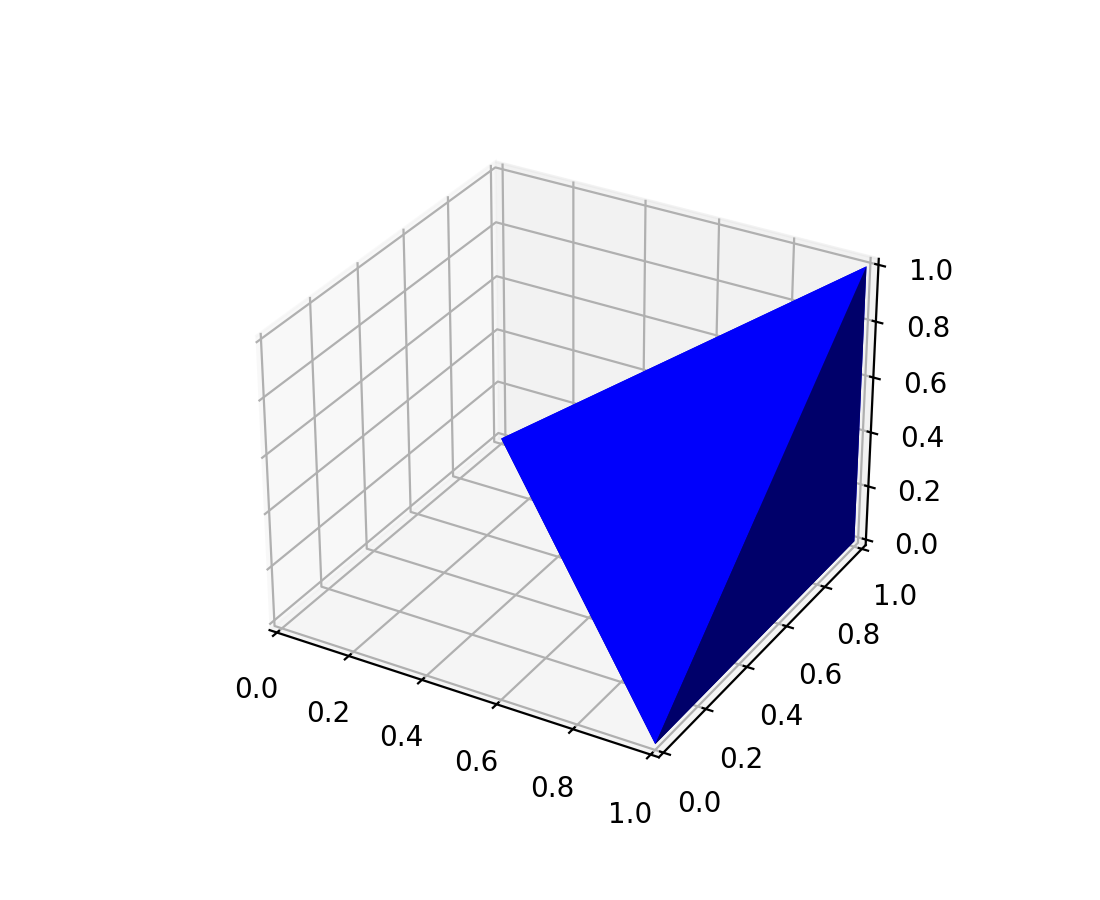
Poly3DCollection 支持阴影#
现在可以对 Poly3DCollection 进行阴影处理.如果多边形是从例如 3D 模型中获得的,这将非常有用.
import numpy as np
import matplotlib.pyplot as plt
from mpl_toolkits.mplot3d.art3d import Poly3DCollection

# Define 3D shape
block = np.array([
    [[1, 1, 0],
     [1, 0, 0],
     [0, 1, 0]],
    [[1, 1, 0],
     [1, 1, 1],
     [1, 0, 0]],
    [[1, 1, 0],
     [1, 1, 1],
     [0, 1, 0]],
    [[1, 0, 0],
     [1, 1, 1],
     [0, 1, 0]]
])

ax = plt.subplot(projection='3d')
pc = Poly3DCollection(block, facecolors='b', shade=True)
ax.add_collection(pc)
plt.show()
(Source code, png)
用于 3D 面板颜色的 rcParam#
rcParams rcParams["axes3d.xaxis.panecolor"] (default: (0.95, 0.95, 0.95, 0.5)) , rcParams["axes3d.yaxis.panecolor"] (default: (0.9, 0.9, 0.9, 0.5)) , rcParams["axes3d.zaxis.panecolor"] (default: (0.925, 0.925, 0.925, 0.5)) 可用于更改 3D 图中背景面板的颜色.请注意,通常最好给它们略微不同的阴影以获得"3D 效果",并使它们稍微透明(alpha < 1).
import matplotlib.pyplot as plt
with plt.rc_context({'axes3d.xaxis.panecolor': (0.9, 0.0, 0.0, 0.5),
                     'axes3d.yaxis.panecolor': (0.7, 0.0, 0.0, 0.5),
                     'axes3d.zaxis.panecolor': (0.8, 0.0, 0.0, 0.5)}):
    fig = plt.figure()
    fig.add_subplot(projection='3d')
(Source code, png)

图形和轴布局#
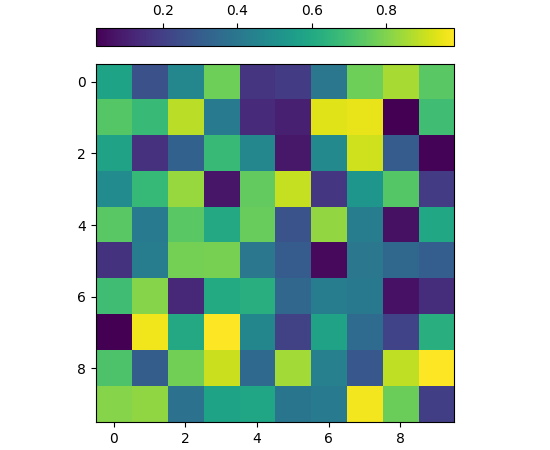
colorbar 现在有一个 location 关键字参数#
colorbar 方法现在支持 location 关键字参数,以便更轻松地定位颜色条.当使用 cax 关键字参数提供您自己的插入轴时,这非常有用,并且其行为类似于未提供轴的情况(其中 location 关键字传递).不再需要 orientation 和 ticklocation,因为它们由 location 决定.如果不需要自动设置,仍然可以提供 ticklocation.(也可以提供 orientation,但必须与 location 兼容.)
一个例子是:
import matplotlib.pyplot as plt
import numpy as np
rng = np.random.default_rng(19680801)
imdata = rng.random((10, 10))
fig, ax = plt.subplots(layout='constrained')
im = ax.imshow(imdata)
fig.colorbar(im, cax=ax.inset_axes([0, 1.05, 1, 0.05]),
             location='top')
(Source code, png)

使用 constrained_layout 可以将 Figure 图例放置在图形外部#
如果 Constrained layout 通过以字符串"outside"开头的 loc 关键字参数指定了 Figure 图例,它将为图例留出空间.这些代码与轴代码不同,因为"outside upper right"将在图形顶部为图例留出空间,而"outside right upper"将在图形的右侧留出空间.有关详细信息, 请参阅 图例指南 .
subplot_mosaic 中的每个子图关键字参数#
现在可以将关键字参数传递到 Figure.subplot_mosaic 和 pyplot.subplot_mosaic 中每次调用 add_subplot 的 Axes 创建中:
fig, axd = plt.subplot_mosaic(
    "AB;CD",
    per_subplot_kw={
        "A": {"projection": "polar"},
        ("C", "D"): {"xscale": "log"},
        "B": {"projection": "3d"},
    },
)
(Source code, png)

这对于创建具有混合投影的镶嵌图特别有用,但任何关键字参数都可以传递.
subplot_mosaic 不再是临时的#
Figure.subplot_mosaic 和 pyplot.subplot_mosaic 上的 API 现在被认为是稳定的,并且将在 Matplotlib 的正常弃用流程下进行更改.
小部件改进#
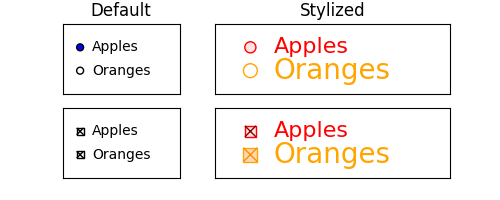
按钮小部件的自定义样式#
可以通过 RadioButtons 的 label_props 和 radio_props 参数以及 CheckButtons 的 label_props,frame_props 和 check_props 参数来实现按钮小部件的其他自定义样式.
from matplotlib.widgets import CheckButtons, RadioButtons

fig, ax = plt.subplots(nrows=2, ncols=2, figsize=(5, 2), width_ratios=[1, 2])
default_rb = RadioButtons(ax[0, 0], ['Apples', 'Oranges'])
styled_rb = RadioButtons(ax[0, 1], ['Apples', 'Oranges'],
                         label_props={'color': ['red', 'orange'],
                                      'fontsize': [16, 20]},
                         radio_props={'edgecolor': ['red', 'orange'],
                                      'facecolor': ['mistyrose', 'peachpuff']})

default_cb = CheckButtons(ax[1, 0], ['Apples', 'Oranges'],
                          actives=[True, True])
styled_cb = CheckButtons(ax[1, 1], ['Apples', 'Oranges'],
                         actives=[True, True],
                         label_props={'color': ['red', 'orange'],
                                      'fontsize': [16, 20]},
                         frame_props={'edgecolor': ['red', 'orange'],
                                      'facecolor': ['mistyrose', 'peachpuff']},
                         check_props={'color': ['darkred', 'darkorange']})

ax[0, 0].set_title('Default')
ax[0, 1].set_title('Stylized')
(Source code, png)

其他改进#
Figure 钩子#
新的 rcParams["figure.hooks"] (default: []) 提供了一种机制来注册 pyplot figures 上的任意自定义;它是一个 "dotted.module.name:dotted.callable.name" 字符串列表,指定在 pyplot.figure 创建的每个 figure 上调用的函数;这些函数可以例如附加回调或修改工具栏.有关工具栏自定义的示例,请参见 mplcvd -- figure hook 的一个例子 .
新的和改进的叙述性文档#
全新的 Animations 教程.
新的分组和堆叠 bar chart 示例.
contributing guide 中面向新贡献者的新章节以及重新组织的 git 说明.
重构的 注释 教程.