备注
Go to the end 下载完整的示例代码.
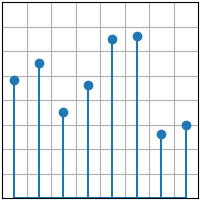
stem(x, y)#
创建茎图.
请参见 stem .
import matplotlib.pyplot as plt
import numpy as np

plt.style.use('_mpl-gallery')

# make data
x = 0.5 + np.arange(8)
y = [4.8, 5.5, 3.5, 4.6, 6.5, 6.6, 2.6, 3.0]

# plot
fig, ax = plt.subplots()

ax.stem(x, y)

ax.set(xlim=(0, 8), xticks=np.arange(1, 8),
       ylim=(0, 8), yticks=np.arange(1, 8))

plt.show()